American commercial shipbuilding has been in decline since the 1860s — heavily protected and persistently uncompetitive since that time. The Jones Act is the latest and most durable expression of that protection, requiring that merchandise transported by water between two U.S. points be carried on vessels that are U.S.-built, U.S.-documented, U.S.-owned, and U.S.-crewed. What follows documents the decline of U.S. commercial shipbuilding, its consequences for the American fleet, and a history of how it unfolded.
All figures from primary sources · MARAD Annual Reports · MARAD Vessel Inventory Reports · UNCTAD
What the data show
0.03%
U.S. share of global commercial shipbuilding output in 2025, placing the United States at #19 in the world
4–5×
The cost premium for Jones Act vessels over comparable foreign-built ships — $335M vs. ~$75M for a containership
426 → 92
Jones Act oceangoing fleet size, 1980 to present — a decline of nearly 80% under the law's continuous protection
Foreign
Origin of the engines, propellers, and key components in virtually every Jones Act vessel built in the past two decades
China
Jones Act operators have sent vessels for 60+ major repairs and conversions at Chinese state-owned shipyards
1892
Year the New York Times declared it "practically impossible" to build ships competitively in the U.S.
Section 01
Global Output
American shipyards once delivered a meaningful share of the world's commercial fleet. That era ended decades ago. Today the United States accounts for a fraction of a percent of global output.
The Jones Act, Section 27 of the Merchant Marine Act of 1920, codified at 46 U.S.C. § 55102, requires that merchandise transported by water between two U.S. points be carried on vessels that are U.S.-built, U.S.-documented, U.S.-owned, and U.S.-crewed. One of its principal political justifications has long been that it sustains American shipbuilding, but it is a claim the data does not support.
0.03%
U.S. share of world shipbuilding output, 2025 (UNCTAD)
#19
U.S. rank among shipbuilding nations by gross tonnage, 2025 (UNCTAD)
1965
Last year U.S. shipyards delivered more than 3% of world vessel output
2.8
Average U.S.-built Jones Act vessels delivered per year, 2000–2023
Vessels Delivered — World vs. United States, 1951–1986
Ship deliveries by country of construction, 1951–1986
The structural gap: U.S. deliveries (blue), which never exceeded 7% of world output in the post-World War II era and only twice exceeded 5%, shrank to near-zero by the mid-1980s as global production surged. The gap is structural, not cyclical.
Source: MARAD Annual Reports, 1951–1987. Excludes Great Lakes, inland waterways, Armed Forces, tugs, ferries, and cable ships. Asterisks (*) denote calendar years; all other years are fiscal years (ending June 30 through FY1976, September 30 for FY1977). The worldwide delivery series reflects the reporting period used in each annual report — fiscal year tables through the FY1977 report, calendar year tables from CY1978 onward. No worldwide delivery table found for 1973 or 1979 in the MARAD annual report series. FY1956–1963 world vessel counts include combination passenger/cargo ships counted separately in source tables; DWT for those years covers freighters and tankers only, as combination ships were reported in gross tons only.
Deadweight Tonnage Delivered — World vs. United States, 1951–1986
Thousands of deadweight tons, 1951–1986
Source: MARAD Annual Reports, 1951–1987. Tonnage in thousands DWT. Asterisks (*) denote calendar years; all other years are fiscal years (ending June 30 through FY1976, September 30 for FY1977). The worldwide delivery series reflects the reporting period used in each annual report — fiscal year tables through the FY1977 report, calendar year tables from CY1978 onward. No worldwide delivery table found for 1973 or 1979 in the MARAD annual report series. DWT for FY1956–1963 covers freighters and tankers only; combination passenger/cargo vessels were reported in gross tons in those years' source tables.
U.S. Merchant Shipbuilding Output, 1914–2023
Gross tonnage of merchant ships delivered from U.S. private yards per year · dashed regions mark U.S. war involvement and Construction Differential Subsidy (CDS)* era
The wartime spikes: The two wartime spikes (1917–19, 1941–45) are not evidence of a competitive industry but of what emergency mobilization looks like.
The 1970s surge: The secondary peak in the mid-to-late 1970s reflects two converging factors: the Merchant Marine Act of 1970, which extended construction subsidies to tankers and bulk carriers and authorized over 300 new ships (producing what MARAD called the most significant peacetime shipbuilding activity in U.S. history), and the opening of the Trans-Alaska Pipeline System in June 1977, which created immediate demand for large Jones Act crude oil tankers. As the New York Times noted in 1980, increased demand for tonnage to transport oil from Alaska had been “a relatively bright spot in the past few years.” Only around 200 of the planned 300 ships were ultimately built, and when pipeline-era tanker demand subsided, so did output.
The CDS debate: The Reagan administration's 1981 decision to defund the Construction Differential Subsidy did accelerate the collapse of U.S. commercial shipbuilding output. But any claims that a healthy industry was killed by a policy choice do not survive scrutiny of the pre-1981 record. By 1978, Business Weekwas warning of imminent shipyard closures despite Japanese yards quoting prices 60 percent below U.S. levels, already past the program's 50 percent statutory cap, meaning CDS could not close the gap even at its legal maximum. A 1979 Baltimore Suninvestigation the following year found that Avondale, considered the most efficient yard in the country, required a subsidy of 49.98 percent — essentially the legal ceiling — to win a single contract, and that two comparable ships could be built overseas for the price of one American vessel. By mid-1980, the New York Timesnoted only three commercial ship orders so far that year and described the shipbuilding industry as “limping along.” In a letter transmitting MARAD's own 1979 annual report, the Secretary of Commerce warned that the near-term outlook for commercial shipbuilding was “clouded,” while MARAD's 1980 annual report disclosed that no CDS contracts had been awarded for new ship construction that fiscal year.
Sources: 1914–1945: F.G. Fassett Jr., ed., The Shipbuilding Business in the United States of America, Vol. I (New York: Society of Naval Architects and Marine Engineers, 1948), Table 9 — merchant ships of 2,000 GT and over from private yards. 1947–1976: MARAD, via Shipbuilding History (Tom Colton). 1977–2023: Shipbuilding History (Tom Colton) / USCG. 1946 data unavailable (fiscal-year DWT data only; see U.S. Maritime Commission Annual Report, FY1946, Appendix C). WWI U.S. involvement: April 1917–November 1918. WWII U.S. involvement: December 1941–August 1945. "Most significant peacetime shipbuilding activity" characterization: Robert J. Blackwell, Assistant Secretary of Commerce for Maritime Affairs, testimony before the House Armed Services Committee, Seapower Subcommittee, September 19, 1974; repeated in MARAD, Fact Sheet: U.S. Domestic Shipbuilding, July 2024. *CDS (Construction Differential Subsidy): a federal program authorized by the Merchant Marine Act of 1936 that covered the cost differential between building a ship in the U.S. versus a foreign yard, making American-built vessels cost-competitive for international trade. First contracts 1938. Reagan administration defunded the program in 1981; ships already under contract continued to be built and delivered through 1984. Last CDS ship: Falcon Champion (Bath Iron Works), delivered 1984. CDS debate takeaway sources: "The Growing Threat of Shipyard Closings," Business Week, May 1, 1978; Stephen E. Nordlinger, "Despite Subsidies, U.S. Shipyards Lag Behind Foreign Competition," Baltimore Sun, August 16, 1979; Eric Pace, "U.S. Shipyards in the Doldrums," New York Times, July 23, 1980; MARAD Annual Report, Fiscal Year 1980, Chapter 1 (Shipbuilding), Contract Awards.
Jones Act Oceangoing Ship Deliveries by Type, 1987–2023
Ships delivered for U.S. domestic trade; type breakdown available from 2000 onward
Sources: 1987–1999 totals (type breakdown unavailable): Shipbuilding History (Tom Colton), shipbuildinghistory.com/statistics/recent.htm, "Tankers and Cargo Ships" column, last updated April 30, 2021. 2000–2023 with type breakdown: MARAD Vessel Inventory Reports (January 2026), Jones Act eligible vessels by year of build. The two series match in 18 of 21 overlap years; discrepancies of ±1 vessel in 2006, 2008, 2019, and 2020 reflect minor definitional differences. The 2022 Great Lakes bar represents the Mark W. Barker, a self-unloading bulk carrier built for Great Lakes service; all other vessels are oceangoing. Tankers account for 47 of 67 oceangoing deliveries (70%) from 2000–2023.
The tanker boom and bust: Tankers dominated deliveries from 2007–2017, driven by two overlapping factors: the need to replace single-hull vessels ahead of the Oil Pollution Act of 1990's 2015 double-hull deadline, and the domestic crude transport demand created by the fracking boom. With the crude export ban in place until December 2015, domestically produced oil had to move by Jones Act tanker, spurring a concentrated run of newbuilds. Once the ban was lifted, demand collapsed. According to a 2020 GAO report, "the boom in the construction of tankers to transport stranded domestic crude oil prior to the repeal of the export ban left shipping companies with excess shipping capacity" — and one of the two remaining U.S. shipyards capable of building Jones Act crude tankers saw a 90% drop in employment. No Jones Act tanker has been delivered since 2017.
U.S. Rank in World Shipbuilding Output, 2014–2025
Top 25 countries by gross tonnage; United States highlighted
The global ranking: In 2025, the U.S. ranked 19th among shipbuilding nations by gross tonnage. That placed the U.S. behind not only China, South Korea, and Japan, but also other countries such as the Netherlands, Vietnam, and Malaysia.
Source: UNCTAD Data Hub, "Ships built by country of building, annual (analytical)," last updated June 18, 2026. Gross tonnage indicator. Top 25 countries with reported output shown. United States row highlighted.
United States vs. European Shipbuilding Output, 2014–2025
Thousands of gross tons delivered; European sub-regions stacked
Source: UNCTAD Data Hub, "Ships built by country of building, annual (analytical)," last updated June 18, 2026. Eastern Europe: Romania, Poland, Russia, Ukraine, others. Northern Europe: Finland, Norway, Denmark, others. Southern Europe: Italy, Spain, Croatia, others. Western Europe: Germany, France, Netherlands, others.
The European comparison: The debate over U.S. shipbuilding competitiveness typically centers on China, Japan, and South Korea. But the gap with these nations is not the most telling comparison. In most years from 2014 to 2025, every European region individually outbuilt the entire United States. The exceptions were 2015 and 2016 — the peak of the Jones Act tanker boom — when elevated U.S. output narrowly exceeded Southern and Northern Europe. Outside the 2015–2016 tanker surge, the U.S. failed to outscore any single European region. Western Europe alone delivered roughly 38 times U.S. output in 2025. Notably, some of the most competitive European shipbuilding nations — including Norway and the Netherlands — are not characterized by elaborate subsidy regimes. OECD peer reviews identify their competitiveness as rooted in specialization into high-value segments, export orientation, and R&D investment rather than protected domestic markets.
In fiscal year 1951, U.S. shipyards delivered 14 oceangoing ships, equivalent to three percent of world output. That share held through fiscal year 1965, supported by the Construction Differential Subsidy, a federal program designed to cover the full differential between American and foreign construction costs for ships operating in international trade (subject to a statutory cap of 50% of total vessel cost). Jones Act vessels in domestic coastwise trade were ineligible for CDS. By fiscal year 1966 it declined to 1.8 percent, and from that point on U.S. shipyards would never again account for more than 3 percent of world ship deliveries.
U.S. output measured in deadweight tons tells a superficially different story, peaking around 1977–1978. The Merchant Marine Act of 1970, which extended subsidies to tankers and bulk carriers and authorized over 300 new ships, provided the policy framework for what became the most significant peacetime shipbuilding activity in U.S. history (though only around 200 of the planned ships were ultimately built). That spike was further assisted by the construction of large tankers to carry Alaska crude oil domestically following the opening of the Trans-Alaska Pipeline System (TAPS) in June 1977.
It was a demand-driven, geographically specific surge, not evidence of restored competitiveness. When pipeline-era demand subsided, the underlying output base that remained was thin and captive. Both the number of ship deliveries and deadweight tonnage make clear that, after the mid-1960s, U.S. commercial shipbuilding ceased to be a meaningful participant in the global market.
The UNCTAD rankings show what the U.S. shipbuilding industry has become in the global context. In 2025, American yards delivered 0.03 percent of world gross tonnage — ranking 19th, behind countries including the Netherlands, Vietnam, and Malaysia. The five-year average from 2021 to 2025 was 0.07 percent, confirming this is not an anomalous performance. In 2025, U.S. yards delivered 25,172 gross tons — less than the combined output of Spain and Portugal (31,284 GT), two countries not generally regarded as major shipbuilding nations.
The industry's retreat from international competition is not recent. According to a 1992 USITC report, U.S. yards had not produced a commercial vessel for export, that is, for foreign-flag operation, since 1960. That remains true today.
"It has not produced a commercial vessel for export (that is, to be foreign-flagged) since 1960."
Since 2000, U.S. yards have averaged fewer than three Jones Act oceangoing ship deliveries per year, and that average is inflated by the mid-2010s tanker surge driven by the fracking boom and a resulting increase in domestic oil transport demand. With the oil export ban still in place until late 2015, domestically produced crude had to move by Jones Act tanker. In most years, the number of oceangoing deliveries is one or two, and sometimes zero. The U.S. Navy’s own fiscal year 2025 shipbuilding plan, as cited in a February 2025 GAO report, acknowledged that U.S. commercial shipbuilding “has experienced a near-total collapse.”
The decline in American commercial shipbuilding has been accompanied by a parallel contraction in the domestic Jones Act fleet. By vessel count, that fleet peaked around 1951 and has contracted in almost every decade since, from more than 400 ships to fewer than 100 today. By deadweight tonnage the picture is no better: the fleet carries roughly 10 percent less cargo capacity than it did in 1951, while the U.S. economy has grown more than nine times over in real terms during the same period.
426
Active domestic trade ships, June 1951
92
Jones Act eligible ships, April 2026
78%
Decline in fleet size, 1951–2026
18 yrs
Median fleet age, January 2026
The long contraction, 1951–2026
U.S. Domestic Trade Fleet — Active Ships vs. U.S. GDP, 1951–2026
Ships (left axis) vs. Real GDP index 1951=100 (right axis) — Sources: MARAD annual reports (1951–2000), MARAD fleet summary tables (2001–2026); BEA/FRED GDPCA
The shrinking fleet: By vessel count, the fleet contracted in every decade after 1951 — under Democratic and Republican administrations, during boom times and recessions. The Jones Act protected the fleet from foreign competition; it could not protect it from the economics of expensive ships.
Source, 1951–2000: MARAD Annual Reports, Employment/Deployment of U.S.-Flag Oceangoing Merchant Fleet, various years. Source, 2001–2026: MARAD U.S.-Flag Privately-Owned Merchant Fleet summary tables and consolidated fleet reports (Jones Act Eligible fleet, Integrated Tug/Barges excluded). Reporting dates vary (see methodology note). Missing data points: 1964, 1972, 1992, 1997. Dec 1974 gap: Employment appendix not located for this reporting period. Intercoastal figures 1980–1985 anomalous — see note. GDP index, 2001–2025: BEA GDPCA (chained 2017 dollars) via FRED, vintage as of Apr. 2026; 2026 omitted pending release of full-year data.
Methodology: Reporting dates shifted multiple times — June 30 (1951–1975), September 30 (1976–1998), with exceptions. The 1970 series includes two snapshots (June 30 and December 31). Break in series, 2000/2001: MARAD stopped publishing the Employment/Deployment series (vessels actually operating in domestic trade) after 2000. The 2001–2026 segment instead tracks the Jones Act Eligible fleet — vessels eligible to carry domestic cargo (built in the U.S., U.S.-owned, U.S.-crewed) — with Integrated Tug/Barges excluded from both vessel counts and DWT for comparability with the pre-2000 series' cargo-vessel scope. The two segments come from different MARAD publications and are not methodologically identical: the annual-report series counts vessels reported as employed in domestic trade, while the summary-table series counts every vessel on MARAD's privately-owned fleet list that meets the eligibility criteria, whether or not it was in domestic service. The step between them reflects the change of source, not a change in the fleet. In the one year both publications cover, they differ by roughly 60 vessels: the FY2000 annual report shows 119 vessels for January–June 2000, while the January 2000 summary table shows 181 (193 including Integrated Tug/Barges). On the summary-table basis alone, the count fell from 181 in January 2000 to 171 in January 2001. Treat the pre- and post-2000 segments as two joined series measuring closely related but not identical concepts, not one continuous measurement. Source notes, 1999–2000: The Jul 1999 and Jun 2000 points are total-fleet vessel counts and carrying capacity (thousands of metric tons) for self-propelled vessels of 1,000 gross tons and over in coastal (including non-contiguous) domestic trade, from MARAD Annual Report FY1999, Table 10 (as of July 1, 1999), and FY2000, Table 9 (January–June 2000). Units: MARAD's FY1999 annual report states that the agency completed its conversion to metric (SI) measurement by 1997; tonnage in earlier annual reports may therefore be reported in long tons, a difference of roughly 1.6% that is not adjusted here.
The 2001–2026 segment comes from a different MARAD publication than the 1951–2000 segment and is not directly comparable to it; see the methodology note. The most recent point is the April 2026 MARAD fleet report (92 vessels, 4,788,996 DWT).
The fleet today, by type
Jones Act Eligible Fleet by Ship Type, 2014–2026
Oceangoing, self-propelled, privately owned, ≥1,000 gross tons; January snapshot each year (2026 figure is the April snapshot)
Source: MARAD Vessel Inventory Reports (XLS), January of each year; 2014–2016 from MARAD Summary Tables 2000–2016 (IHS Maritime/Sea-Web). "Jones Act eligible" = built in U.S., owned by U.S. citizens, crewed by U.S. mariners. Containership/ConRo includes fully cellular containerships and combination containership/roll-on/roll-off vessels. Ro-Ro/Vehicle includes roll-on/roll-off and vehicle carriers. Other includes dry bulk, integrated tug-barges, and miscellaneous.
Water's shrinking share of domestic freight
Water's Share of Domestic Freight — U.S. vs. EU, 1995–2022
Water transport as % of total domestic freight tonne-kilometres/ton-miles (shares are unit-independent)
EU: European Commission, EU Transport Statistical Pocketbook 2024, Table 2.2 (sea + inland waterways ÷ total tonne-kilometres, EU-27). US: BTS, National Transportation Statistics, Table 1-50 (U.S. Ton-Miles of Freight, BTS Special Tabulation), April 2026, domestic water traffic ÷ total ton-miles (excludes foreign-vessel traffic on U.S. waterways and pipeline's share of the denominator is included, per BTS convention).
A comparison, not a causal claim: The EU and U.S. aren't a clean natural experiment — the EU's water share reflects many short-sea routes linking separate countries, while the U.S. is a single continental economy where highways plausibly absorb more freight regardless of any one law. But the U.S. is not short on navigable water: it has thousands of miles of coastline serving major metropolitan ports, the Great Lakes, the Mississippi and other inland river systems, and noncontiguous states and territories reachable only by sea or air — precisely the routes the Jones Act governs. That a comparably developed, water-dependent economy saw its own water share hold essentially flat over the same 27 years while the U.S. share fell by half is, at minimum, hard to square with an inevitability story.
Coastwise Water Transport — Share of U.S. Domestic Freight, 1980–2023
Ton-miles as % of total domestic freight ton-miles, all modes. Coastwise = coastal + noncontiguous (data through 2011); All domestic water includes inland waterways & Great Lakes (through 2023).
Source: BTS, National Transportation Statistics, Table 1-50 (U.S. Ton-Miles of Freight, BTS Special Tabulation), 1980–2011 annual; extended 2012–2023 using U.S. Army Corps of Engineers, Waterborne Commerce of the United States, Part 5, Table 1-4 (water); Association of American Railroads, Railroad Facts (rail); BTS/FHWA Freight Analysis Framework (truck, total). Coastwise breakdown (coastal + noncontiguous) available through 2011 only; total domestic water (including inland waterways and Great Lakes) available through 2023. 1980–1985 coastwise figures elevated by Trans-Alaska Pipeline crude tanker traffic.
The coastwise water series ends in 2011 because BTS discontinued the detailed modal breakdown that separately identified coastwise (coastal and noncontiguous) traffic from inland waterway and Great Lakes traffic after that year. Post-2011 figures for total domestic water freight are available from the Army Corps of Engineers but cannot be disaggregated into coastwise vs. inland on a comparable basis.
U.S. Domestic Freight Transportation Volume by Mode, 1980–2021
Millions of ton-miles, all modes stacked — water flat or declining as truck and rail expand
Source: BTS, National Transportation Statistics, Table 1-50 (U.S. Ton-Miles of Freight, BTS Special Tabulation). Domestic water includes coastwise, inland waterways, and Great Lakes. Pipeline omitted for clarity.
An aging fleet
Median Age by Vessel Type — April 2026
Jones Act eligible oceangoing cargo fleet; ages as of April 2026
Source: MARAD Vessel Inventory Report, April 2026 (XLS), calculated from year-of-build data. Containership/ConRo includes fully cellular containerships and combination containership/roll-on/roll-off vessels. General Cargo includes partial containerships and refrigerated ships. Dashed vertical lines show global fleet average ages: containerships ~14.2 years, tankers ~13.2 years (BIMCO, October 2023; S&P Global/Teekay Tankers, 2024). No comparable figure available for general cargo from primary sources, though UNCTAD identifies it as the oldest vessel type globally. Jones Act figures are median ages; global benchmarks are averages that are not directly comparable but indicative.
On the tanker fleet: The relatively young median age of Jones Act tankers, which were mostly delivered between 2007 and 2017, reflects two factors: first, the need to carry domestically produced crude while the oil export ban remained in place; and second, the requirement to replace single-hull vessels with double-hull vessels ahead of the Oil Pollution Act of 1990's 2015 deadline. No Jones Act tanker has been delivered since 2017. With a median age of 17 years against a global fleet average of 13.2 years, Jones Act tankers are already older than the global benchmark — a gap that will continue to widen without new construction. MARAD places the nominal service life of Jones Act tankers at 20 years. With no vessels under construction, the fleet is approaching end of useful life without a replacement pipeline in place. That 20-year figure, however, bears little relation to actual practice: in 2024, the CEO of one of the largest Jones Act tanker operators stated that Jones Act assets carry an expected service life of 40 years. This is a direct consequence of build costs that make timely replacement economically indefensible.
In August 2025, Hanwha Shipping announced an order for ten MR tankers at Hanwha Philly Shipyard, with first delivery targeted for early 2029 (Hanwha press release, August 2025). No steel has been cut, and the economic viability of Jones Act MR tanker newbuilds at current U.S. construction costs remains in serious doubt. Kinder Morgan's 2026 investor disclosures, which place new Jones Act tanker costs at over $240 million per vessel against international equivalents of roughly $50 million, illustrate why operators have found it difficult to justify orders.
Median Age by Vessel Type, 2016–2026
Jones Act eligible oceangoing cargo fleet; annual snapshots
Source: MARAD Vessel Inventory Reports (XLS), 2016–2026, calculated from year-of-build data. Jones Act figures are median ages. Snapshots are January 1 of each year except the earliest, which is dated February 2, 2016, and the latest, which is dated April 4, 2026. The last Jones Act tanker was delivered in 2017; with no vessels under construction, the tanker line will continue rising. All vessel types aging; no category shows sustained rejuvenation.
This age profile is a direct consequence of the cost of building a Jones Act ship. Because construction costs run four to five times international equivalents, operators cannot justify ordering replacements at anything close to normal intervals. Instead, they extend service lives well past those of foreign-flag competitors, keeping aging hulls in operation not because they are well-suited to the trade but because the alternative is often economically indefensible.
The data bear this out. As of April 2026, roughly 30 percent of the Jones Act fleet is 25 years or older. One ship — the Coastal Trader, serving western Alaska — dates to 1963. Among the 22 U.S.-built Jones Act vessels that left the fleet between 2016 and 2026, the median exit age was 42 and the youngest exits were 33. The El Faro, which sank in October 2015, was 40 years old at the time of her loss.
Between 2020 and 2023, three old ships left the Jones Act containership/ConRo fleet (the 1971-built Lihue, 1980-built Kauai, and the 1973-built Matsonia) while three new vessels entered (the 2020-built Matsonia, 2022-built George III, and the 2023-built Janet Marie). This drove the median age from 30 years down to 18.5, not because the industry had turned a corner, but because the fleet is so small that a handful of deliveries moves the needle dramatically. Since 2024, with no further additions, the median has resumed its climb, reaching 21.5 years by January 2026.
The pattern is consistent across vessel types. This age profile describes a symptom, the cause of which is documented in the next section.
Note on sourcing: The 22-vessel dataset covers U.S.-built Jones Act eligible oceangoing cargo vessels recorded as exiting the fleet in MARAD, U.S. Flag Privately-Owned Merchant Fleet: Summary of Changes from 2016 Onward (December 2025), supplemented by Hansa News (February 2026) for the Mokihana, which exited in early 2026 after the MARAD list's cutoff date. "Exited" means removed from the Jones Act eligible fleet per MARAD records; not all vessels are confirmed scrapped.
Section 03
Cost Premium
Jones Act ships cost four to five times their international equivalents to build. That premium is the direct reason the fleet documented in the previous section is aging, as operators extend service lives far beyond what market economics would otherwise dictate. The premium is structural, persistent, and documented by the operators themselves.
Philly Shipyard (now Hanwha Philly Shipyard) is responsible for roughly 45% (30 of 67) of all Jones Act oceangoing ships delivered from 2000–2025. Photo: Wikimedia Commons.
"New-build MR capital cost >$240MM/vessel with earliest potential deliveries in 2029; Would require term charter rate of >$115K/day to underwrite."
Kinder Morgan 2026 Annual Business Update, January 2026 — current Jones Act tanker charter rates are ~$90,000/day, below the threshold required to justify new construction
Jones Act vs. International Newbuilding Prices
Cost per vessel in millions of dollars; end-2025
The cost premium: A Jones Act containership costs roughly 4–5× more than an equivalent vessel from an Asian yard. This premium is why no Jones Act tanker has been ordered since 2013, and why no containership has been ordered outside of the Aloha-class program.
Sources: International prices from Compass Maritime, Weekly Report, August 3, 2026 (MR tanker: $52M). BRS Group, Shipping and Shipbuilding Markets Annual Review 2026, end-2025, reports $49.5M for MR tankers at South Korea/Japan first-tier yards. U.S. prices: MR tanker from Kinder Morgan 2026 Annual Business Update (January 29, 2026), stated as ">$240MM/vessel"; containership from Matson 2025 Annual Report / Form 10-K ($1.006 billion for three Aloha-class vessels = ~$335M each; 3,440 TEU, Hanwha Philadelphia Shipyard). International containership price (~3,600 TEU) from James Lightbourn, founder of Cavalier Shipping, quoted in the New York Times, February 11, 2026: $75M maximum from an Asian shipyard. All figures in nominal U.S. dollars.
Jones Act MR Tanker: New-Build Economics, 2019 vs. 2026
Capital cost per vessel and charter rate required to justify construction
The economics of new construction: The gap between what Jones Act tanker construction requires to be economical and what the market actually pays has widened since 2019. Charter rates have risen from well below $70,000/day to approximately $90,000/day, but required rates have risen faster, from roughly $70,000/day to more than $115,000/day. The economics of new construction have deteriorated, not improved.
Jones Act Containership Newbuild Cost per TEU, 2015–2025
Cost per TEU in thousands of dollars; containerships only, all figures from primary sources
Sources: Isla Bella / Perla del Caribe — Marine Log / TOTE Services press release, December 15, 2015 ($375M for two; 3,100 TEU; LNG dual-fuel). Daniel K. Inouye / Kaimana Hila — Matson delivery press release, October 2018 ($418M for two; 3,600 TEU; diesel conventional propulsion). George III / Janet Marie — Pasha Group press release, August 25, 2022 ($225M per vessel; 2,525 TEU; LNG dual-fuel). Makua / Malama / Makena — Matson 2025 Annual Report / Form 10-K ($1.006B for three; 3,600 TEU; LNG dual-fuel). International feedermax (~2,700 TEU) — BRS Group, Shipping and Shipbuilding Markets Annual Review 2026, end-2025 price at South Korean/Japanese first-tier yards ($52M). All figures nominal U.S. dollars; per-TEU figures calculated from reported vessel costs and design capacity. TEU figures reflect design/maximum capacity per delivery press releases; Matson's 2025 Annual Report fleet table lists lower operational figures (3,160 and 3,020 TEU for Daniel K. Inouye and Kaimana Hila respectively). Using higher TEU figures is the conservative choice: lower counts would imply a higher cost-per-TEU. Jones Act vessels not directly comparable to each other or to the international benchmark — fuel type and design specifications differ.
Jones Act MR Tanker Newbuild Prices, 2012–2026
Cost per vessel in millions of dollars; all figures from primary sources
Rising costs: Jones Act MR tanker newbuild costs have nearly doubled in under 15 years, from roughly $125 million per vessel in 2012 to an estimated $240 million or more today. Over the same period, international MR tanker newbuild prices rose roughly 25–30 percent — from roughly $35–40 million in 2012–2014 to approximately $50 million today (Compass Maritime, August 2026: $52M). The gap between U.S. and international prices is not narrowing; it is widening.
The most recent Jones Act containership program illustrates the scale of the premium. In late 2022 Matson ordered three Aloha-class containerships from the Hanwha Philadelphia Shipyard that, per Matson's 2025 Annual Report, cost approximately $335 million each ($1.006 billion for all three). James Lightbourn, founder of the shipping financing advisory Cavalier Shipping, told the New York Times that similar ships from an Asian shipyard would cost $75 million at most, less than one-fourth the U.S. price.
The Aloha-class price is not an outlier. In 2017 Pasha Hawaii ordered two 2,525-TEU containerships — the LNG-powered George III and Janet Marie — from Keppel AmFELS in Brownsville, Texas at a contracted price of $200 million each. Both were originally scheduled for delivery in 2020. George III, however, did not arrive until summer 2022, and Janet Marie until summer 2023. By its delivery, George III had cost over $225 million. Meanwhile, in late 2021 Namsung Shipping ordered a conventionally powered 2,500-TEU vessel from a South Korean shipyard for $41 million. That ship, the Starship Neptune, delivered on schedule in October 2023.
The differing propulsion systems have little explanatory power for the price difference. Industry estimates place the LNG propulsion premium at roughly 20–25 percent over conventional diesel newbuilds. Applied to the Starship Neptune price, that implies an LNG-adjusted equivalent of perhaps $50 million per vessel, which is still less than a quarter of what Pasha paid.
For tankers, the economics are similarly punishing. Kinder Morgan's January 2026 investor presentation states that a new Jones Act medium-range tanker costs over $240 million per vessel, with the earliest possible deliveries in 2029. At that capital cost, a term charter rate of more than $115,000 per day would be required to underwrite new construction. Current Jones Act MR tanker charter rates are approximately $90,000 per day. Although far above international equivalents, such rates are nonetheless 28 percent below the threshold to justify new construction.
In comparison, the international newbuilding price of an MR tanker is approximately $52 million, according to Compass Maritime, and $49.5 million per the BRS Group Annual Review 2026. This makes the Jones Act premium approximately five times the international price.
At roughly $50 million for a new MR tanker, retiring a 20-year-old vessel is often economically rational for international operators, as a modern ship offers lower fuel consumption, lower maintenance costs, and higher reliability. At $240 million, the same calculation is more difficult to pencil out, and in a captive market there is less competitive pressure to remove aging tonnage.
The cost premium is structural. World-class shipbuilders specialize and build high volumes for the global market, while U.S. shipbuilders build small volumes for a protected domestic market.
Volume unlocks economies of scale, drives the learning-by-doing that improves productivity, enables investment in productivity-enhancing technology and equipment, and sustains a supplier ecosystem — the specialized steel fabricators, equipment vendors, and subcontractors — without which no yard can function efficiently. Specialization compounds these gains. Yards that build the same vessel type develop repeatable processes, refined designs, and institutional knowledge that one-off producers cannot accumulate.
These are not novel insights. The observation that specialization and volume are key to competitive shipbuilding has been made continuously, by witnesses with direct operational knowledge, for well over a century.
Writing in 1905 for the American Economic Association, economist Royal Meeker noted that where an American yard turned out one steel vessel, an English yard turned out a dozen, many on the same model. This allowed the use of identical parts and cost reductions that no one-off producer could match.
Harvey D. Goulder, a maritime lawyer and counsel to the Lake Carriers' Association, told the Merchant Marine Commission in 1904 that the difficulty with cost at American coast yards "lies very much in the proposition that they are so largely making new things upon new designs." A yard, he pointed out, might build a battleship one year, then a sidewheel excursion steamer, then a tug, then a freight steamer. Each would use a new design, with no accumulated learning to carry forward to the next vessel.
That diagnosis would be repeated in future decades. Homer L. Ferguson, president of Newport News Shipbuilding & Dry Dock Company — one of the country's most capable yards, then as now — told the 1929 Second National Conference on the Merchant Marine that American yards had still been unable to specialize "except on the Lakes." Describing Newport News's own order book of two barges, a yacht, a passenger vessel, and two cruisers all under construction simultaneously, he described the yard as "country practitioners" rather than specialists.
The remedy, Ferguson argued, was straightforward: "the way to get costs down is for one yard to build only one class of vessel and to build that class in sufficient volume to keep going steadily." He acknowledged that foreign yards faced the same volume constraint, but was clear that "the handicap in this country is much more pronounced than abroad, and until we can get volume we cannot cut costs to any appreciable extent."
Fifty years on, M. Lee Rice, president of Ogden Transportation Corp. and chief executive of Avondale Shipyard, testified before Congress in 1979 that the limited domestic market was "one of the very important factors" in U.S. shipbuilding costs. "If you look at my shipyard today, I am building six different kinds of vessels, all at the same time. That creates by its very nature a higher cost than if I were building a good number of one class of vessel."
The economic logic is well documented. A 1975 GAO study found that series production reduces costs through specialized facilities and learning-curve effects, estimating that realizing the full benefits requires building five to ten ships of the same type — a threshold the U.S. domestic market rarely, if ever, reaches.
The same study offered another key observation. It documented that over 1970–73, more than half the output of the eight largest merchant shipbuilders was for export, while more than a third of the tonnage added to their own fleets was foreign-built. In other words, major shipbuilding nations were simultaneously exporting and importing ships.
This is exactly what economic logic and comparative advantage would predict, with countries specializing in the vessel types they build most efficiently and importing the rest. In contrast, the United States exported roughly 1 percent of shipbuilding output and imported almost nothing — the expected result of a country that prohibits the use of foreign-built vessels in its domestic commerce.
By building small volumes of a variety of vessel types, U.S. yards have few opportunities to apply lessons learned during the construction process. A 2002 analysis by the CNA Corporation put hard numbers on the learning curve, or lack thereof. One U.S. shipyard reported that building the first vessel of a type required three times the labor hours of the final three in a series of thirty, a 67 percent reduction. Korean and Japanese yards building fifty commercial ships a year capture these gains continuously, while U.S. yards building one or two have sometimes even experienced reverse learning, with costs on consecutive ships actually increasing.
When a Korean yard begins a new vessel type, it draws on accumulated knowledge from similar recent builds. U.S. yards typically have no such foundation.
This is reflected in a yawning productivity differential. A 2001 study published in SNAME Transactions, the journal of the Society of Naval Architects and Marine Engineers, found that the gap between the best international yards and U.S. commercial yards was a factor of five to seven, measured on an apples-to-apples basis using the internationally accepted Compensated Gross Tonnage productivity metric.
A 2001 national security assessment by the Commerce Department's Bureau of Export Administration reached the same conclusion. It found that U.S. shipbuilding productivity lagged Europe and Japan not because of wage rates — which were actually higher abroad — but because of organizational efficiency. Not only was the U.S. behind, but the gap had widened over the preceding decade. And it has not closed.
Lawmakers who have visited both U.S. and Asian shipyards in recent years have described the contrast in stark terms. Former National Security Advisor and SHIPS for America Act co-sponsor Mike Waltz, after visiting Hanwha and Hyundai facilities in Asia, observed that some U.S. yards "look like [they] haven't changed since the 1930s." A South Korean lawmaker who visited the Philadelphia Shipyard — the yard responsible for the greatest share of Jones Act ship deliveries since 2000 — after Hanwha's acquisition was similarly blunt, stating that "it looks like a shipyard from the 1980s."
"The productivity is practically nil — and technically it's far behind the Japanese."— Constantine Gratsos, president of Victory Carriers, New York Times, July 1980
The 2001 SNAME Transactions study identified the U.S. shipbuilding quandary as a "chicken and egg" situation: adequate productivity cannot be achieved without adequate throughput, and adequate throughput cannot be achieved without adequate productivity.
A 2008 paper in the Journal of Ship Production by naval architect William O. Gray — a former Bethlehem Steel shipbuilder and recipient of SNAME's highest honor — described U.S. large yards as "jacks of all trades, masters of none," combining Navy and commercial work, repair and newbuilding, without the focused repeat-order production that drives efficiency.
The Jones Act bears responsibility here. Ensconced within a small, insulated domestic market, U.S. shipbuilders lack the volume that productivity requires and the pressure of international competition to specialize and innovate.
As MIT Professor Ernst Frankel observed in a 1996 paper in the Journal of Ship Production, "it is a basic finding of economics that government subsidies, aids, protection, and regulation of an industry will cause its productivity to decline." High costs inevitably result.
One need not be steeped in free-market economics to understand the logic. Speaking at the same 1929 conference that Homer Ferguson of Newport News Shipbuilding addressed, Andrew Furuseth, president of the International Seamen's Union, argued that the build requirement had handed American shipyards "a monopoly unlike anything else in any other trade or occupation in the United States." His prescription was blunt: "There is no way in which you can build ships in competition with the world except by abolishing the monopoly."
Shipyards that do not face world-class competition should not be expected to perform at world-class levels.
"You have given to the American shipbuilder a monopoly the like of which is not to be found in any other trade or in any other calling or in any other occupation in the United States."— Andrew Furuseth, President, International Seamen's Union, Proceedings of the Second National Conference on the Merchant Marine, January 23, 1929
What about foreign subsidies? South Korea, Japan, and China all subsidize their shipbuilding industries, to varying degrees, a point Jones Act defenders frequently cite to argue that U.S. shipbuilding faces an inherently uneven playing field. The observation is accurate but incomplete. The United States also subsidizes its shipbuilding in multiple ways, most significantly through the Jones Act's guaranteed captive market as well as federal programs including Title XI loan guarantees, small shipyard grants, the Capital Construction Fund, and the Construction Reserve Fund. There is also state and local support. Notably, American shipyards rejected a 1996 OECD agreement that would have eliminated shipbuilding subsidies across all major shipbuilding nations. Although the New York Times noted that America's competitors would have had to "give up far more than the United States would" under the deal, the agreement collapsed in Congress following opposition from large U.S. shipyards. The opposition suggested little confidence by U.S. yards in their ability to compete even under a multilateral subsidy ban. There is no evidence that the industry's attitude has since changed.
The deeper issue is structural. No country of shipbuilding significance has sought to bolster its competitiveness by creating a captive domestic market akin to the Jones Act. Every other major shipbuilding nation competes internationally, forcing productivity improvements regardless of subsidy levels. The Jones Act's captive market removes that pressure entirely. The question is not whether foreign yards are subsidized, but how much explanatory power foreign subsidies have for the U.S. industry's travails. There is little evidence to suggest American shipbuilding would be in a dramatically different place even in a subsidy-free market environment.
92 of 105
U.S. shipbuilding and repair companies that said outdated infrastructure impedes operational efficiency — most of it dating to World War II–era federal investment (GAO-25-107304 (June 2025))
The decline of U.S. commercial shipbuilding cannot be reduced to a single cause, with other contributing factors including management failures, workforce gaps, and the legacy of mixing naval and commercial work. Nor is the U.S. story unique. European shipbuilding has also contracted dramatically as the industry consolidated toward East Asia over the past half century. The Jones Act did not produce this outcome alone, and its absence would not have guaranteed a thriving U.S. shipbuilding industry.
Yet it is almost undeniable that the law, by structurally insulating the industry from competitive pressure and guaranteeing a market regardless of cost or quality, is a major contributor to the sector's poor performance. The only open question is how much better condition it would find itself in today had the United States not gone down its protectionist path.
Note on sourcing: Productivity gap of five to seven times: Thomas Lamb, "World-Class Shipbuilders: Their Productivity Using Lean-Manufacturing Principles," SNAME Transactions, Vol. 109 (2001), pp. 285–308. Commerce Department productivity findings and widening gap: U.S. Department of Commerce, Bureau of Export Administration, National Security Assessment of the U.S. Shipbuilding and Repair Industry (May 2001), pp. 58–59. Ernst Frankel quote on subsidies and productivity: Ernst Frankel, "Economics and Management of American Shipbuilding and the Potential for Commercial Competitiveness," Journal of Ship Production, Vol. 12, No. 1 (1996), pp. 1–10, as cited in William O. Gray, "Performance of Major US Shipyards in 20th/21st Century," Journal of Ship Production, Vol. 24, No. 4 (November 2008), pp. 202–213. "Jacks of all trades, masters of none" characterization: Gray (2008), ibid. Royal Meeker volume and identical parts observation: Royal Meeker, History of Shipping Subsidies, Publications of the American Economic Association, Third Series, Vol. VI, No. 3 (Macmillan, 1905). Harvey D. Goulder "new things upon new designs" testimony: Hearings on the Great Lakes and Pacific Coast before the Merchant Marine Commission, Vol. II (Washington: GPO, 1904), p. 799. Homer L. Ferguson specialization, "country practitioners," remedy, and foreign yards concession quotes: Proceedings of the Second National Conference on the Merchant Marine, held under auspices of the United States Shipping Board, Washington, D.C., January 23–24, 1929. M. Lee Rice testimony on domestic market and vessel variety: Omnibus Maritime Bill — Part 2, Hearings before the Subcommittee on Merchant Marine, Committee on Merchant Marine and Fisheries, House of Representatives, 96th Congress, 1st Session, Serial No. 96–26 (1979). Series production cost reductions, five-to-ten ship threshold, and export/import data: U.S. General Accounting Office, Are Federal Maritime Policies Promoting an Efficient and Effective U.S. Merchant Marine?, PSAD-75-44 (1975). Learning curve quantification (67% reduction, reverse learning, Korean/Japanese volume): CNA Corporation, David L. Kirkpatrick, Improving U.S. Shipbuilding Competitiveness, D0006988.A1 (2002). Andrew Furuseth "iron-clad monopoly" and "abolish the monopoly" quotes and submitted notes: Proceedings of the Second National Conference on the Merchant Marine, January 23–24, 1929.
Section 04
Made in America?
The Jones Act's domestic-build requirement rests on an implicit bargain: higher costs in exchange for genuine self-sufficiency in shipbuilding. But the bargain is illusory. American shipyards are deeply dependent on foreign key components, foreign designs, and foreign engines. The United States pays an enormous premium for ships that are, in any meaningful sense, only partially American-made.
>50%
"At least half" of parts and components in a Jones Act vessel are imported, per Philadelphia Shipyard executive
0
Jones Act vessels built since 2010 with an American-made propeller; none built since 2000 with an American engine; none in the fleet with American-built generators (Petitt, Independent Institute, 2026)
1.5%
Maximum share of a vessel's steel weight that may be foreign-fabricated for Jones Act coastwise eligibility (46 C.F.R. § 67.97) — equipment, engines, and machinery modules are excluded from this calculation entirely
"No Jones Act ship with an American-made engine has been built since 2000, nor one with an American propeller since 2010, nor one with an American anchor since 1998, and there are no ships in the Jones Act fleet with American-built generators."
Caleb Petitt, "Jones Act Parts Dataset: Where Ships Really Come From," Independent Institute, April 7, 2026, independent.org
The Jones Act requires that ships serving U.S. domestic trade be built in the United States. To meet this qualification, vessels must be assembled in a U.S. shipyard, with all major components of the hull and superstructure fabricated domestically. Equipment, outfitting, engines, and machinery are excluded. A vessel incorporating foreign-built modules, provided they are installed in a U.S. shipyard, does not lose its Jones Act eligibility. The law says nothing about the origin of the ship's design, its propulsion system, or the components that go into it.
U.S. shipyards take full advantage of this flexibility. The result is that a "U.S.-built" Jones Act ship may be designed abroad, powered by a foreign engine, and assembled with components sourced from overseas, including China.
This reliance on a foreign supply chain is extensive. A Philadelphia Shipyard executive acknowledged at a 2015 MARAD meeting with the Shipbuilders Council of America that, of the more than one million parts and components in a ship, "at least half of them... are going to be imported."
The president of General Dynamics NASSCO was equally direct in comments submitted to MARAD the same year, noting that "NASSCO's supply chain is routed primarily through Busan, Korea."
A dataset compiled by researcher Caleb Petitt and published by the Independent Institute in April 2026 sheds similar light on the widespread use of imports. Examining the Jones Act fleet's 93 oceangoing cargo ships, it found that no Jones Act vessel with an American-made engine had been built since 2000, no vessel with an American propeller since 2010, no vessel with an American anchor since 1998, and not a single vessel in the fleet has American-built generators. Korean suppliers dominated across all four categories, with Chinese-made components also present across all four.
Jones Act Fleet: Where the Parts Come From
Propulsion, propeller, anchor, and generator suppliers for 93 Jones Act vessels — compiled by Caleb Petitt, Independent Institute, April 2026. Read the full analysis ↗
Vessel ↕
Type ↕
Built ↕
Engine
Propeller
Anchor
Generator
Builder
Source: Caleb Petitt, "Jones Act Parts Dataset: Where Ships Really Come From," Independent Institute, April 7, 2026. Dataset covers 93 Jones Act vessels tracking propulsion, propeller, anchor, and generator suppliers based on ABS records. Blank cells indicate supplier data not available in source records. Color coding: ChinaKoreaUSA
Two specific vessels, the Isla Bella and Perla del Caribe, help illustrate the extent of Korean involvement in American shipbuilding. As noted by a September 2013 Coast Guard determination letter, NASSCO was under contract to purchase "the vessel design, as well as most of the equipment and material necessary to construct each vessel" from a Korean source. The exceptions were "most steel plate, flat bar, weld rod and paint."
The Congressional Research Service, meanwhile, has noted that NASSCO partnered with Daewoo Shipbuilding for design, engineering, and procurement support, with engines, piping, crew quarters, and portions of the hull imported from Korea and assembled in the United States. Shipyard unions have referred to such vessels as "kit ships."
The dependence is not confined to NASSCO. Veteran-class tankers constructed at what was then Aker Philadelphia Shipyard each required approximately 500 shipping containers of materials imported from Busan as well as an additional 25 bulk shipments for large items such as the main engine, propeller, and anchors. The authors of a 2007 paper on the tanker program observed that "the great majority of equipment, outfitting and materials for these vessels comes from Korea."
"The current model used by many of the commercial US builders is to partner with a foreign shipyard to design and supply most of the vessels built today anyway... This model would still be Jones Act compliant since the hull and superstructure are US built and the tanks and control are just systems."
David Heller, MARAD, internal email to Anthony Fisher (MARAD), cc: Richard Balzano (MARAD), February 21, 2019 — obtained via FOIA
The Janet Marie is the most recently built Jones Act containership. Delivered in 2023 by the Keppel AmFELS shipyard in Brownsville, Texas, it provides the latest available snapshot of the U.S. shipbuilding industry's heavy reliance on imports. The anchor chains come from Jiangsu province, and the cranes were manufactured by the China State Shipbuilding Corporation. The propeller and propeller shaft are also Chinese. The propulsion control system is South Korean, as is the main engine, built to a Danish-German design. The generators are Czech. This reflects only what can be gleaned from the major components listed in the Janet Marie's ABS classification record.
Foreign Components Aboard a Single Jones Act Vessel
Janet Marie (IMO 9837107) — the most recently delivered Jones Act containership (built 2023, Keppel AmFELS); U.S. flag, port of Honolulu, operated by Pasha Hawaii. The preceding vessel, George III (built 2022, same yard, same operator), shares the same main engine, propeller, and generator suppliers per its ABS Record.
Component
Manufacturer
Country
Anchor chains (port & starboard)
Jiangsu Asian Star Anchor Chain Co.
China
Anchors (port & starboard)
Jiangsu Xiangsheng Heavy Ind.
China
Provision stores cranes (×2)
CSSC Nanjing Luzhou Machine Co. (designed by MacGregor, Sweden)
China / Sweden
Fixed pitch propeller
Zhenjiang Tongzhou Propeller Co.
China
Propeller shaft
Baoding Technology Co.
China
Fired exhaust gas boiler
Alfa Laval Qingdao Ltd.
China
Main diesel engine
HSD Engine Co. (Doosan-MAN B&W design)
South Korea
Main propulsion system
Kongsberg Maritime Korea Ltd.
South Korea
Generators (×3)
Siemens Electric Machines S.R.O.
Czech Republic
Cargo handling davits
Shin Myung Tech Co.
South Korea
Source: ABS Record, Janet Marie (IMO 9837107), Class # 23272133, absrecord.eagle.org. Data from Vessel Assets tab, Machinery section. The George III (Pasha Hawaii, built 2022, Keppel AmFELS) shares the same main diesel engine (Doosan-MAN B&W / HSD Engine Co.), propeller (Zhenjiang Tongzhou Propeller Co.), and generators (Siemens Electric Machines S.R.O.) per its ABS Record at absrecord.eagle.org.
There is another foreign dimension. At the time of the Janet Marie's delivery, Keppel AmFELS was owned by Keppel Corporation of Singapore and has since been sold to Turkish firm Karpowership. Other U.S. shipyards are also foreign-owned: Hanwha Philly Shipyard has South Korean ownership, Austal USA in Mobile, Alabama is a subsidiary of Australian firm Austal, and Bay Shipbuilding in Wisconsin is owned by Italy's Fincantieri.
"Events in South Korea that prevent one or more significant subcontractors to Philly Shipyard from performing."
Beyond materials and ownership, U.S. shipyards also use foreign labor. At a 2023 maritime industry forum in Washington, D.C., John Graykowski, a maritime consultant and former Senior Vice President and General Counsel of Aker Philadelphia Shipyard, acknowledged during Q&A that the yard has flown in Korean technicians to perform engine installations. A Korean technician at the yard corroborated the broader pattern, describing in a 2026 account reported by the Chosun Ilbo how Korean experts had participated in shipbuilding there for five to ten years prior to Hanwha's acquisition.
West Coast shipyard NASSCO, which builds both Navy and commercial vessels, employed 36 Mexican engineers to install power plants, engines, and machinery aboard a Navy vessel.
Vessels employed under the Jones Act may carry the designation of "U.S.-built," but the law does not free the United States from foreign reliance for its commercial shipbuilding needs. What it actually produces is something more modest: vessels assembled at U.S. facilities using foreign designs, foreign components, foreign capital, and in some cases foreign labor, all at prices that can run four to five times the international market rate. If there is something distinctively American about a Jones Act ship, it may be less the vessel itself than the price paid for it.
Note on sourcing: Petitt dataset findings from Caleb Petitt, "Jones Act Parts Dataset: Where Ships Really Come From," Independent Institute, April 7, 2026, https://www.independent.org/article/2026/04/07/jones-act-parts-dataset-where-ships-really-come-from/. Dataset covers 93 Jones Act vessels tracking propulsion, propeller, anchor, and generator suppliers; 26 vessels have at least one Chinese-made component across those four categories. 1985 supplier base testimony from Hearings before the House Subcommittee on Merchant Marine, 99th Congress, 1st Session, Serial No. 99-52, July 30, 1985. NASSCO/Daewoo partnership and kit ships characterization: Congressional Research Service, Report R45725 (John Frittelli), congress.gov/crs-product/R45725. NASSCO "hundred times" quote: Congressional Research Service, Report R43653 (John Frittelli), congress.gov/crs-product/R43653. NASSCO design and materials from Korean source confirmed by USCG NVDC determination letter, ref. 16713/5/2, September 24, 2013 [source]. Aloha-class 1.5% steel threshold, machinery module exclusion, and Korean shipbuilding angles from USCG NVDC determination letter re: Aloha Class CV3600 at Philly Shipyard for Matson, ref. 16713/5/2, July 25, 2017, winston.com/a/web/126900/Philly-ShipyardAloha.pdf. NASSCO supply chain through Busan confirmed by Harris comments to MARAD, May 2015. 500 containers from Busan, 35,000 individual items, and Korean majority of equipment from Jeremy Small (Aker Philadelphia Shipyard) and William Nugent (OSG Ship Management), "Shipbuilding Experience Outside of Asia: A Cooperative Global Approach to U.S. Shipbuilding," TSCF 2007 Shipbuilders Meeting, archived at web.archive.org. Hanwha ownership of Philly Shipyard and South Korean subcontractor risk disclosure from Matson, Inc., Annual Report / Form 10-K [source]. MARAD internal email: David Heller to Anthony Fisher, cc: Richard Balzano, February 21, 2019, Subject: LNG Carriers — obtained via FOIA. Janet Marie identified as most recently delivered Jones Act containership (build year 2023, Keppel AmFELS, operator Pasha Hawaii) from MARAD, United States Flag Privately-Owned Merchant Fleet Report, January 5, 2026. Janet Marie component data from ABS Record (absrecord.eagle.org), accessed May 2026. George III engine, propeller, and generator suppliers confirmed from ABS Record, George III (Container Carrier), absrecord.eagle.org, accessed May 2026. AmFELS sale from Seatrium to Karpowership: The Maritime Executive, September 23, 2025, maritime-executive.com; sale completion confirmed Offshore Energy, February 3, 2026.
Section 05
American Ships, Chinese Shipyards
The Jones Act is increasingly justified as a bulwark against Chinese maritime dominance. But the law's formidable shipbuilding costs have produced an aging fleet that goes where maintenance is affordable and available. One such destination is China.
60
Repairs completed by COSCO Shipping Shipyard (Nantong) on Matson vessels by 2021 — described by COSCO as a record for most repaired ships and longest cooperation with any single customer (COSCO press release, September 2021)
2026
The Horizon Spirit (to be renamed Russel G) was undergoing propulsion replacement at COSCO Shipping Shipyard (Nantong) as of mid-2026
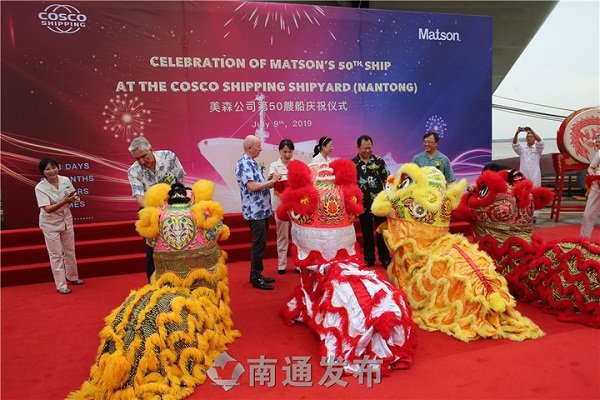
July 9, 2019 — Nantong, China
"Celebration of Matson's 50th Ship at the COSCO Shipping Shipyard (Nantong)"
Officials from Matson and COSCO Shipping mark Matson's 50th ship repair at the state-owned COSCO Nantong yard in July 2019, as reported by the China Daily. In 2021, the count reached 60 vessel repairs.
COSCO Nantong Shipyard is a subsidiary of China COSCO Shipping, the state-owned conglomerate that Beijing has cultivated as a cornerstone of its maritime ambitions. It is also, for the past two decades, a preferred maintenance and conversion facility for the Jones Act fleet.
The relationship dates to at least 2001, but gained public attention in 2006–07 when Matson had work done on the Mokihana at COSCO Nantong as part of a conversion to a ConRo vessel. This prompted a federal court challenge in which the Shipbuilders Council of America and Pasha Hawaii Transport Lines, Matson's sole Jones Act competitor in the West Coast–Hawaii trade lane, argued the ships had been so substantially rebuilt abroad as to lose Jones Act eligibility (ships lose their coastwise endorsement if structural steel changes exceed 7.5% of hull weight, with USCG discretion up to 10%). A federal judge, however, sided with Matson.
By 2007 TradeWindsreported that COSCO Nantong had made “something of a speciality out of Jones Act work.” In 2019, Matson and COSCO Nantong held a ceremony to mark the 50th Matson vessel repair, and two years later the total reached 60. In 2023–2024, Matson sent three more Jones Act containerships to COSCO Nantong to retrofit their engines to LNG. The bill totaled approximately $166 million, an amount sufficient to purchase three 2,700 TEU containerships from a Japanese or Korean shipyard with $10 million left over.
"Matson has been hiding behind the Jones Act for years to keep foreign competition out of its markets, but then getting pennies on the dollar for repairs in foreign shipyards. They are hypocrites."
Allen Walker, President, Shipbuilders Council of America · TradeWinds, September 28, 2006
This dynamic is not limited to Matson. Pasha Hawaii, which had opposed Matson's early use of COSCO Nantong in federal court, subsequently elected to have substantial work performed on its own vessels at the same yard. In both 2021 and 2025, Pasha received written confirmation from the U.S. Coast Guard that converting its 1980-built containerships Horizon Reliance and Horizon Spirit from steam power to LNG at COSCO Nantong would not affect the vessels' Jones Act compliance. The conversion of the Horizon Reliance has been completed, with Pasha touting the ship — newly renamed George II — as the world's first steam-to-LNG conversion.
That it was the first vessel in the world to undergo this conversion is due to the unique economics of the Jones Act, in which repowering ships well past 40 years of age to LNG — which carries a price tag in the tens of millions of dollars (Matson paid $72 million to retrofit one of its ships, the Manukai, to LNG power) — is more economically rational than purchasing a new U.S.-built ship.
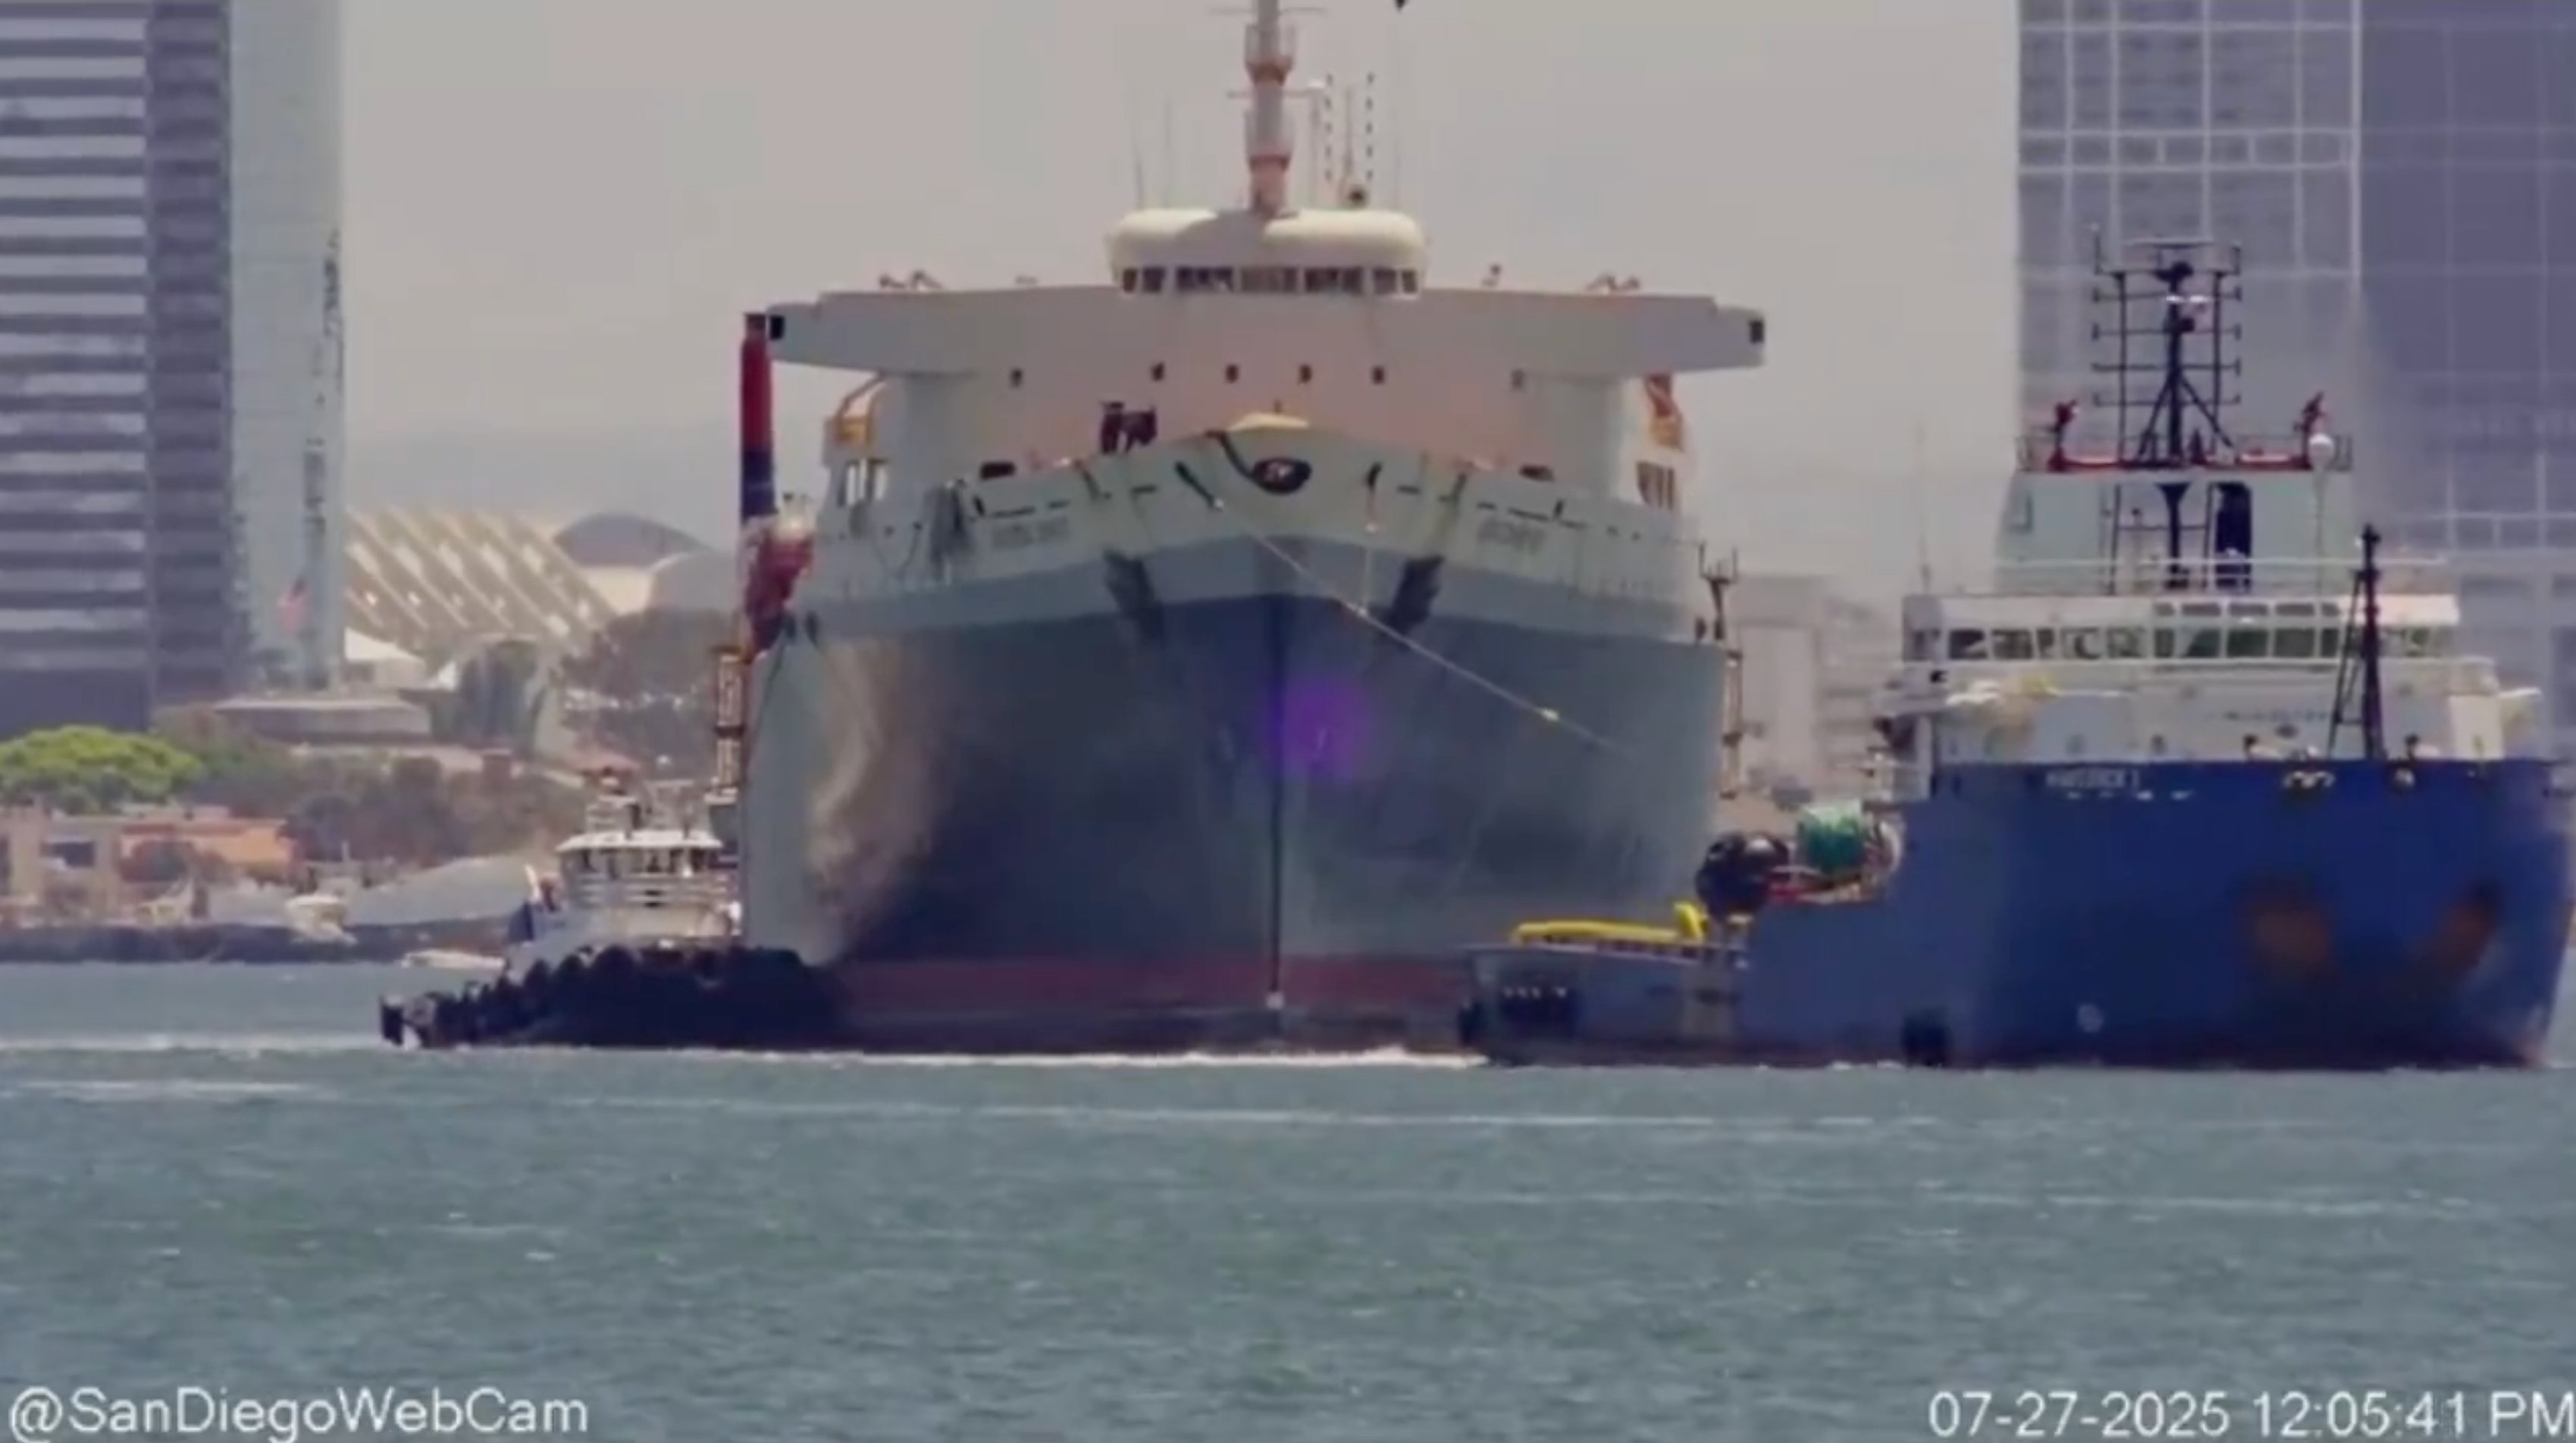
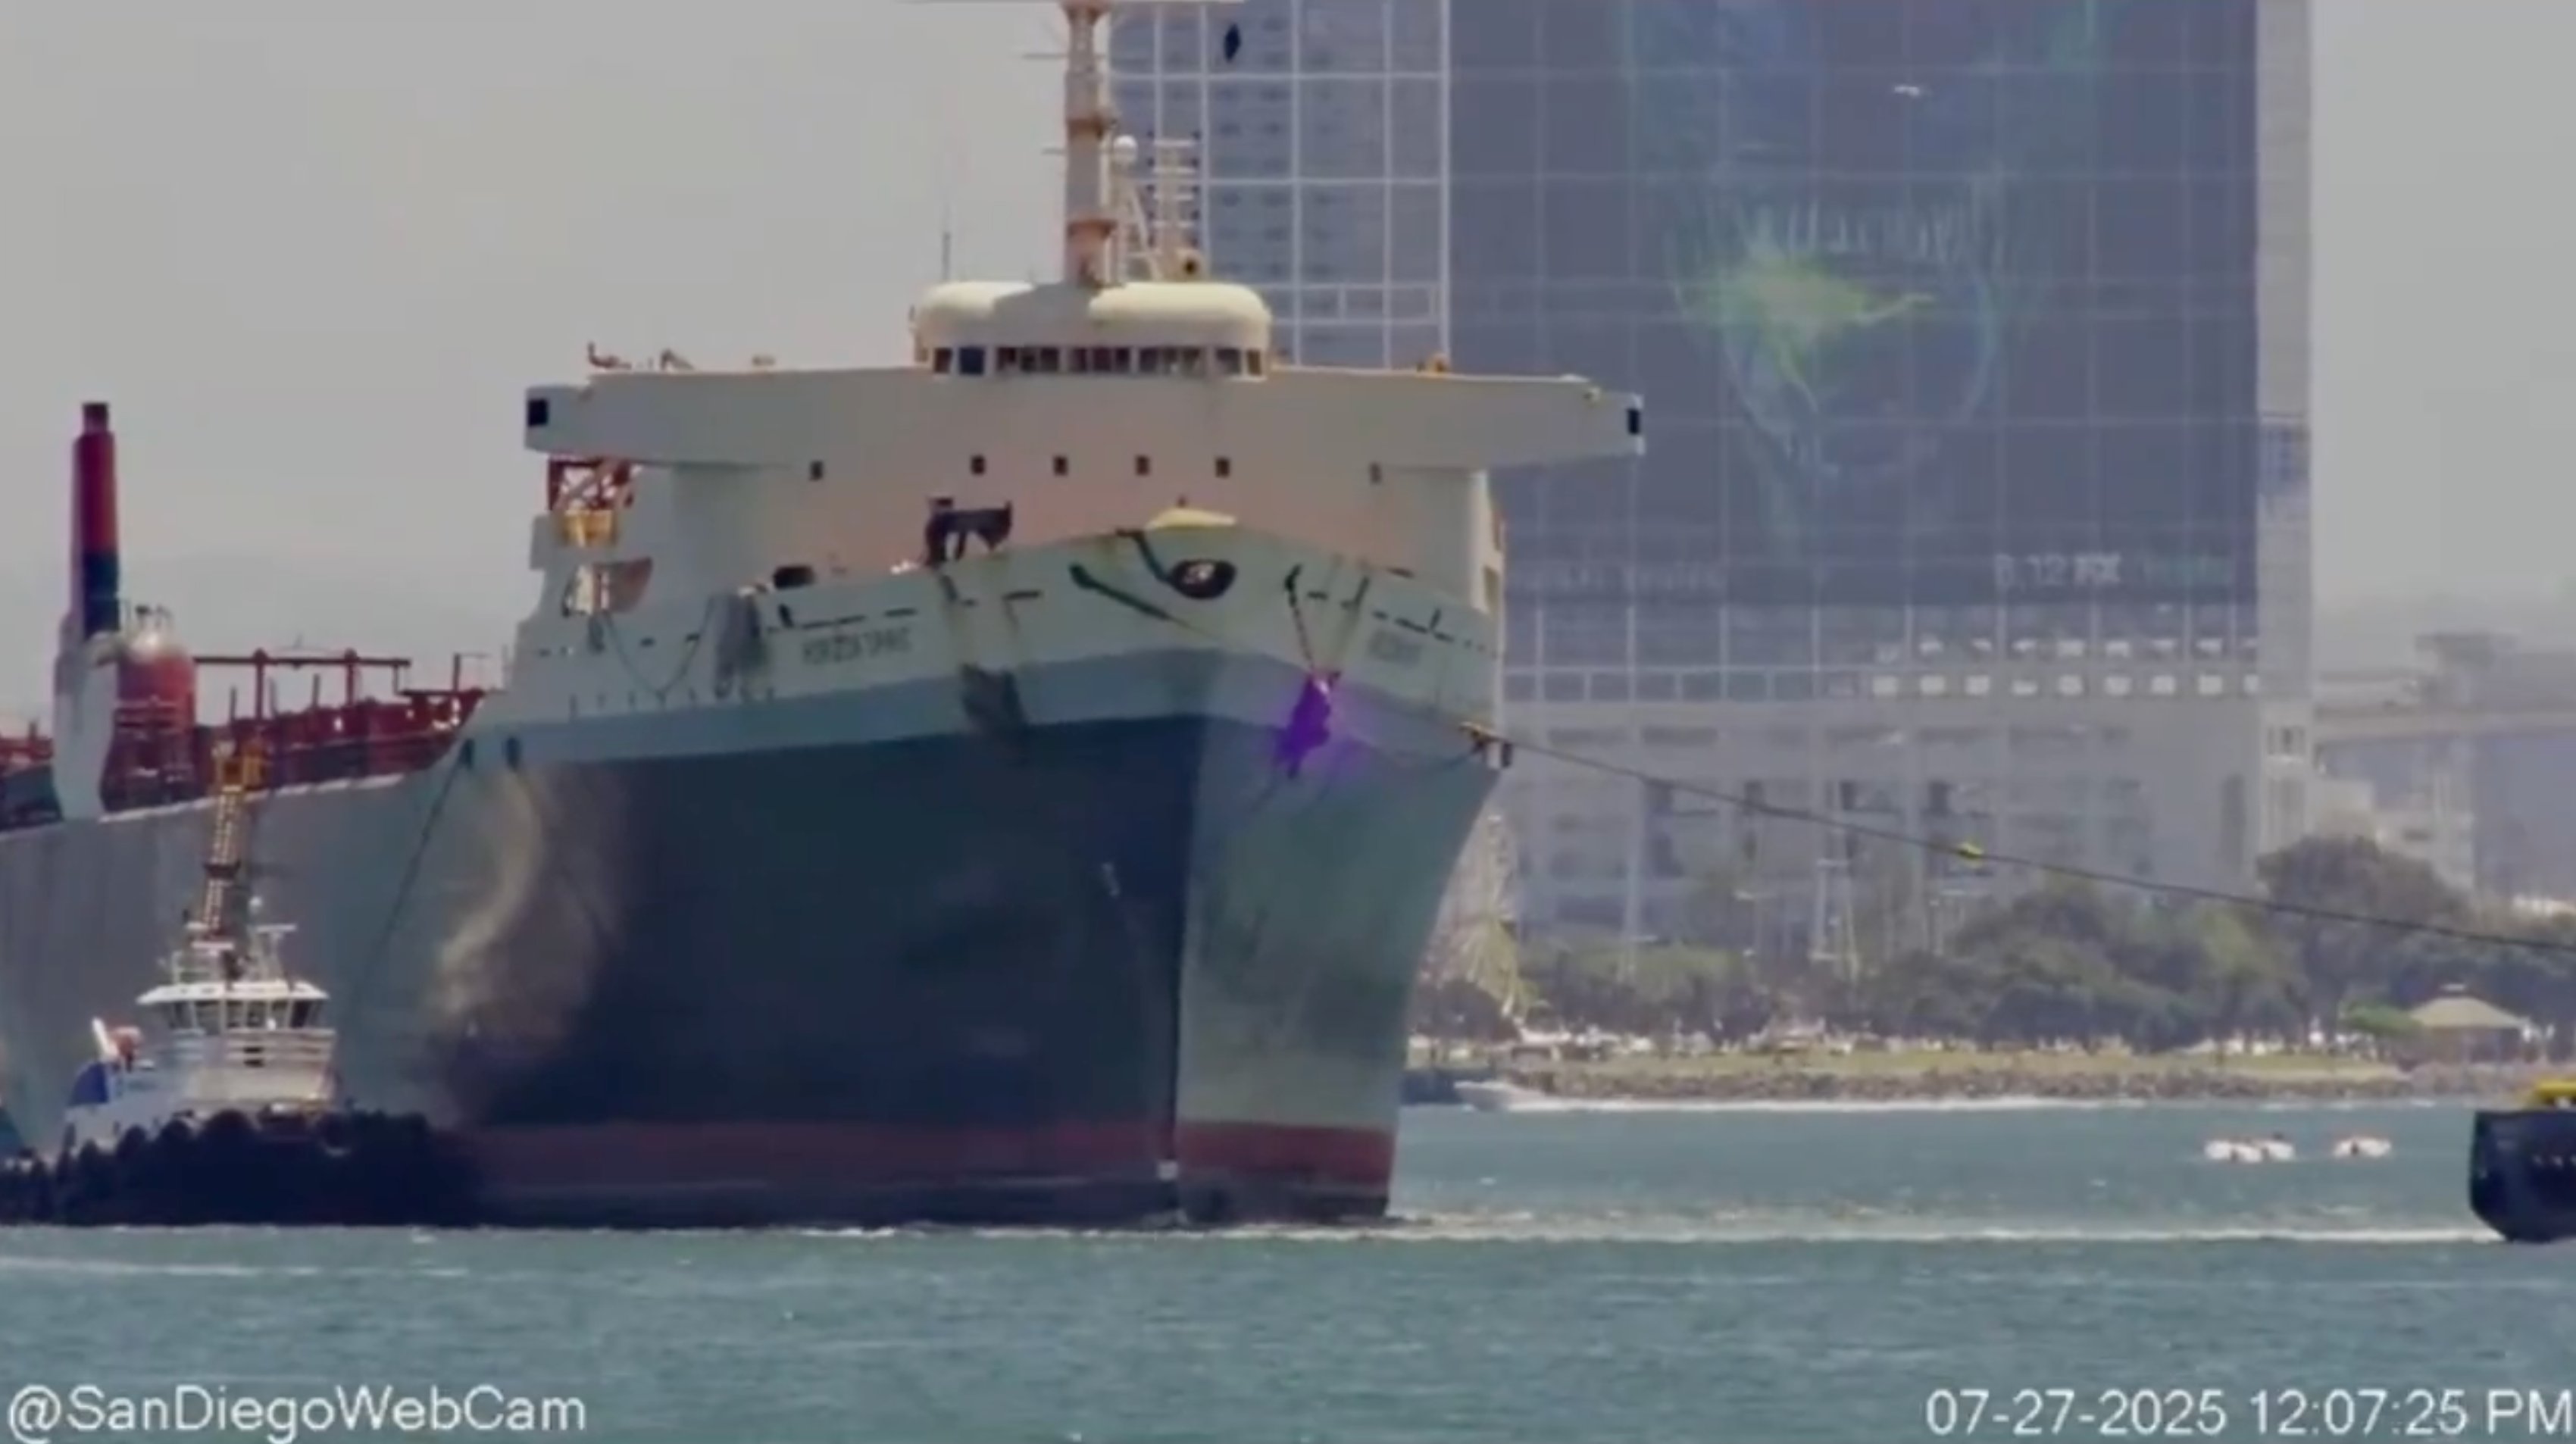
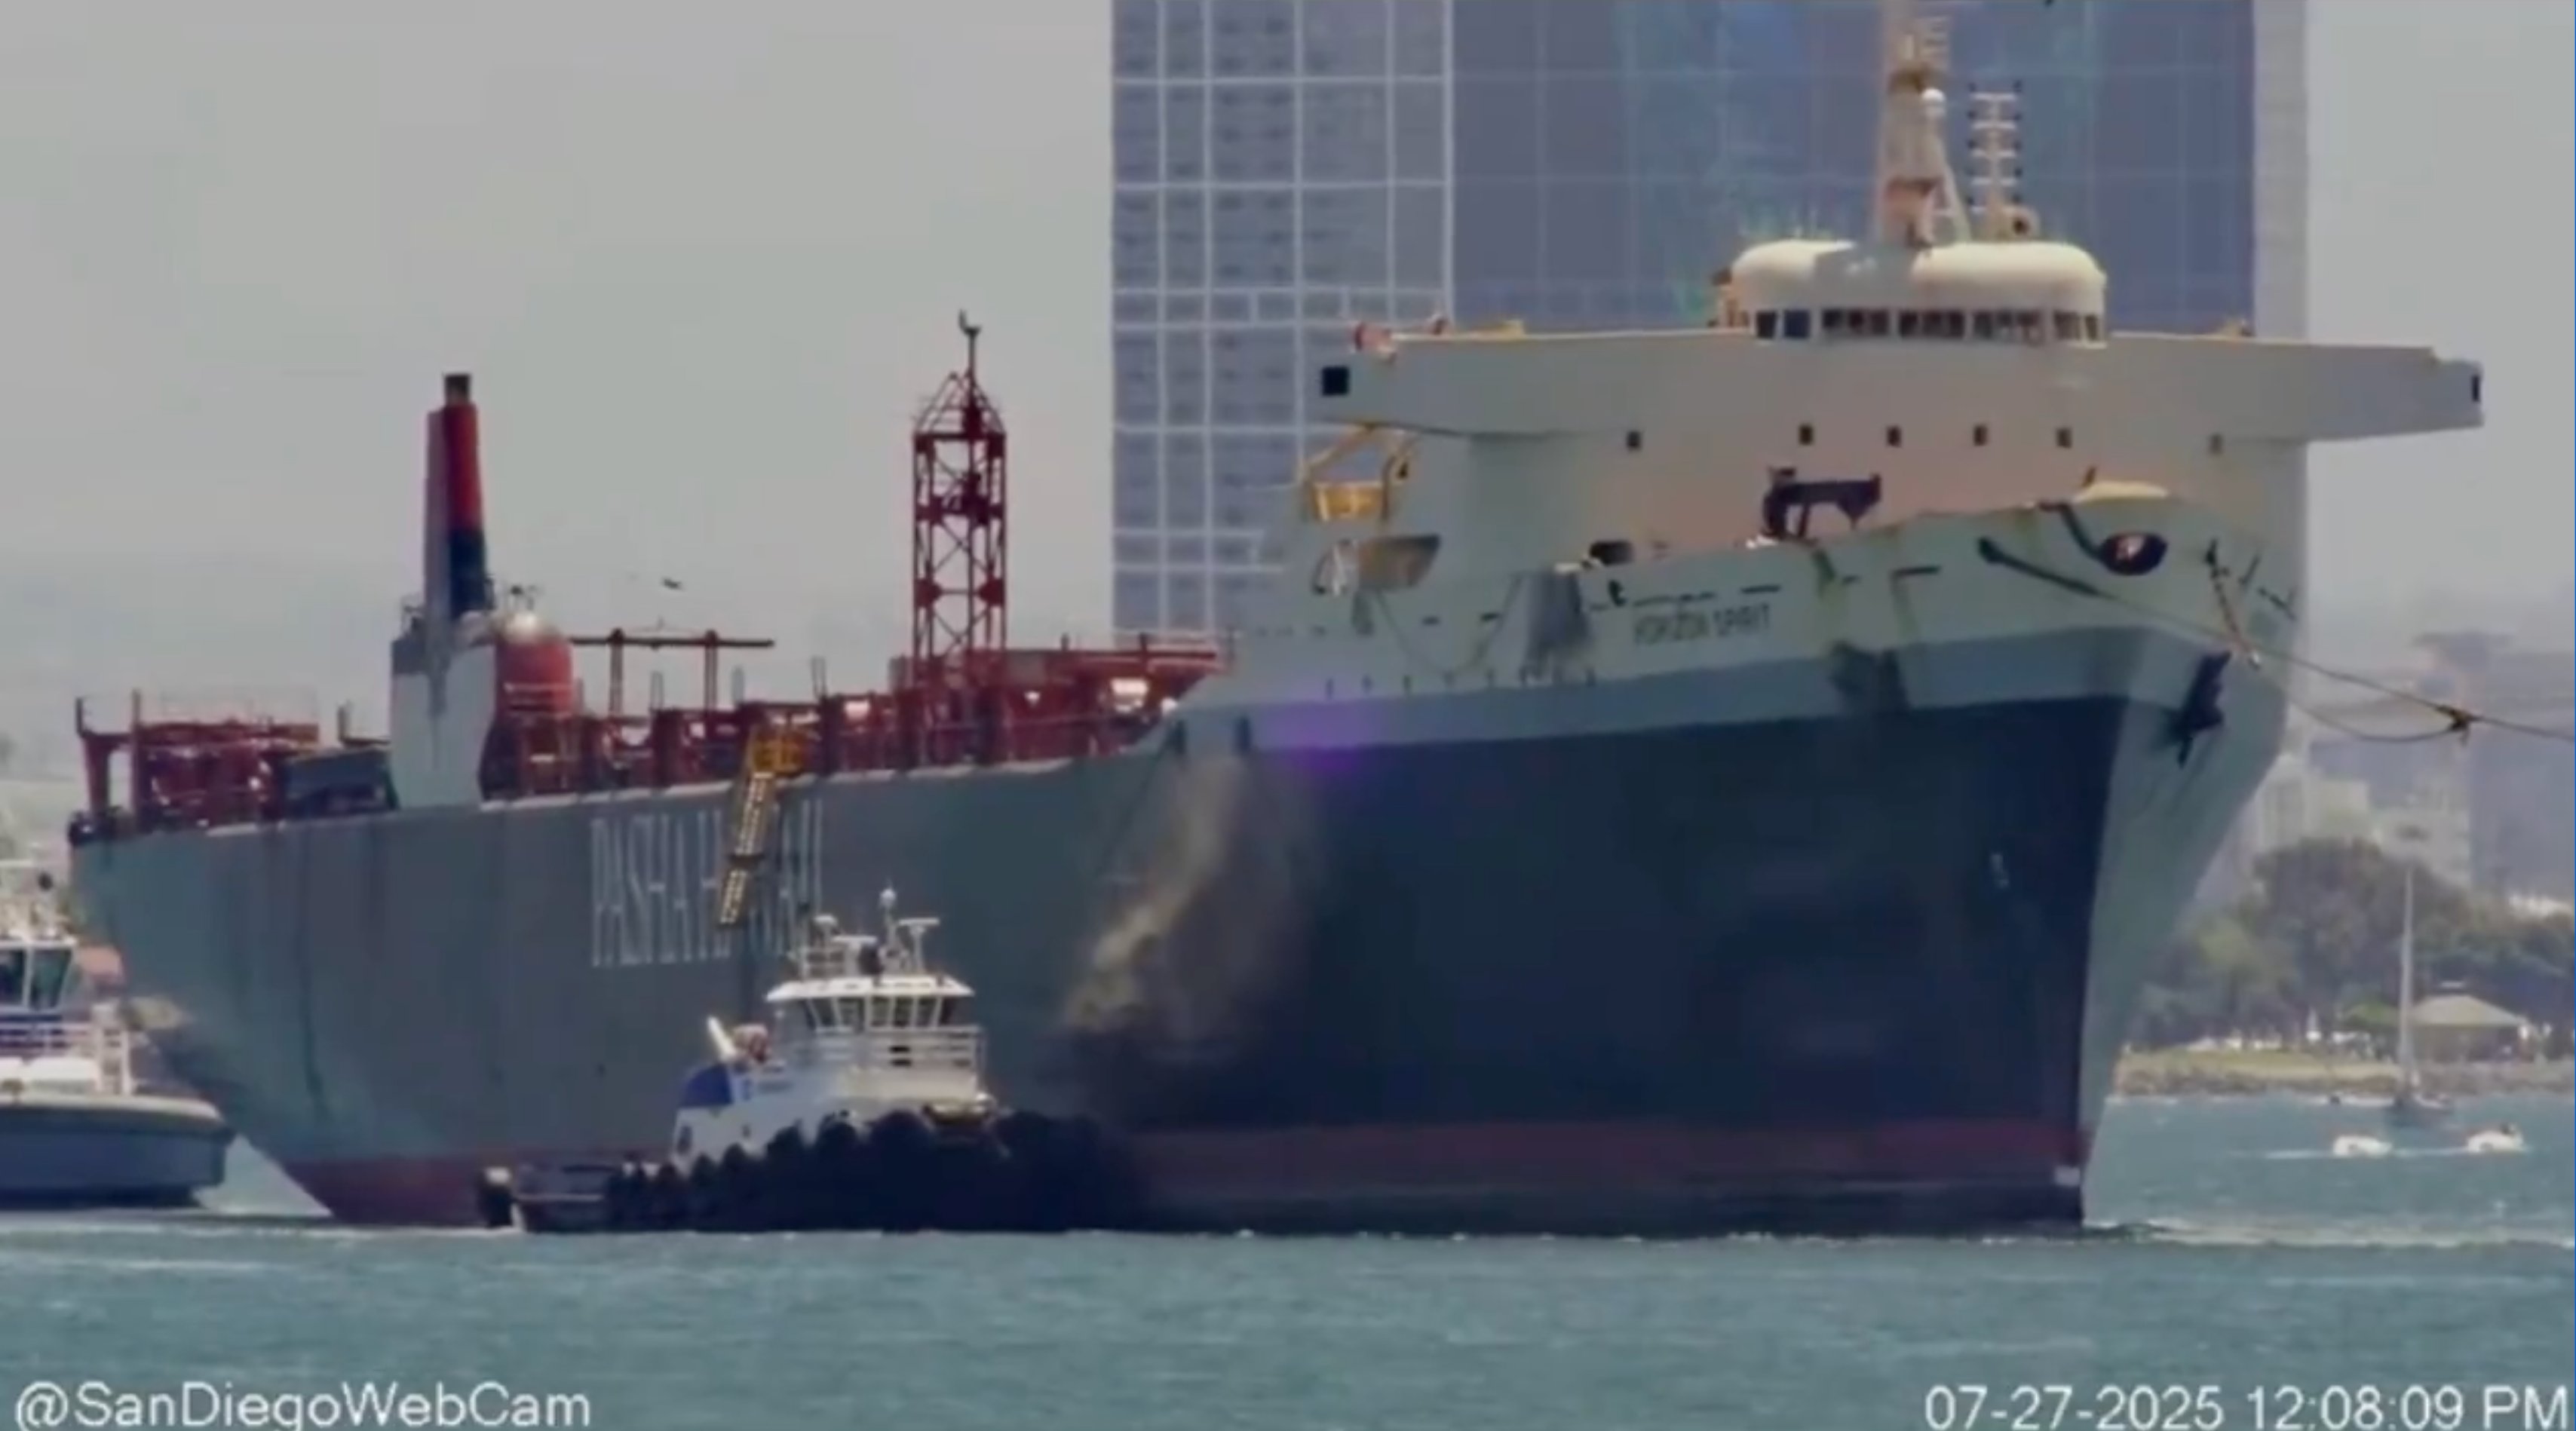
The Horizon Spirit Departs San Diego — July 27, 2025
Horizon Spirit departed San Diego 18 days after its owner, Pasha Hawaii, received a USCG determination letter (July 9, 2025) confirming that converting it to LNG power in China would not affect its Jones Act eligibility. Upon completion the ship will be renamed Russel G.
12:05 PM
12:07 PM
12:08 PM
Source: @SanDiegoWebCam, July 27, 2025. "HORIZON SPIRIT" visible on hull (frame 2). Frames captured at 12:05, 12:07, and 12:08 PM. Vessel subsequently photographed under tow by Maverick I, San Diego to Nantong, China, September 17, 2025 (KipperT, shipspotting.com). The conversion — main engine replacement and structural modifications — was approved by the USCG on July 9, 2025 (ref. 16713/5/3), with explicit confirmation that Jones Act coastwise eligibility would be unaffected.
Horizon Reliance (O/N 625873) · Pasha Hawaii Holdings LLC · COSCO Nantong China Shipyard
"...proposed work to be done in a foreign shipyard (specifically, COSCO Nantong China Shipyard) to the vessel HORIZON RELIANCE..."
"performance of the work as described to the Vessel outside of the United States will not result in the Vessel being deemed to have been rebuilt foreign and, consequently, will not adversely affect the Vessel's eligibility to engage in the coastwise trades of the United States."
— Christina G. Washburn, Director, National Vessel Documentation Center ·
Full determination (PDF)
Following its steam-to-LNG conversion at COSCO Nantong — which Pasha described as "the first steam-to-LNG conversion in the world" — the vessel was renamed MV George II. The ship pictured at the top of this section, Horizon Spirit, is its sister vessel, currently undergoing an identical conversion at the same yard under a separate USCG determination (ref. 16713/5/3, July 9, 2025).
The role of Chinese shipyards in Jones Act vessel repairs and conversions extends beyond the Pacific trade lanes. National Shipping of America's National Glory, which serves Puerto Rico, was converted from a general cargo ship to a containership at the Chengxi Shipyard in Jiangsu province. Seabulk Tankers sent two Jones Act tankers to China for double-hull conversion after finding the all-in cost was roughly one-third of the best American quote. Seacor chairman Charles Fabrikant said he was “shocked when I saw the numbers.”
The cost advantage over U.S. yards is even more notable after considering that foreign vessel repairs are subject to a U.S. duty of 50 percent. Despite this, a MARAD-commissioned survey found that carriers reported using foreign shipyards for American-flag ship repairs because “the cost of having repairs performed overseas and paying the duty was often lower than having the repairs performed in U.S. shipyards.”
But U.S. shipyards' lack of cost competitiveness is not the only driver of foreign repairs and overhauls. Availability is another issue. Jared Gale of Dole testified at a 2025 USTR Section 301 hearing that when the company sought U.S. drydocking for two vessels, one yard never responded, one declined while waiting on a Navy contract, and a third lacked the necessary skills. Dole had no choice but to send the ships overseas. In July 2017, Resolve Marine received USCG approval to drydock its vessel Resolve Pioneer in Zhoushan because no suitable drydock was available in Alaska.
The relationship between Jones Act carriers and Chinese shipyards is a study in unintended effects. In theory, the Jones Act ensures a steady demand for U.S.-built ships to sustain American shipyards and promote national security. In reality, U.S. shipyard costs have become so out of step with international norms that aging ships are dispatched to the repair facilities of a leading geopolitical rival to extend their working lives far beyond what U.S. economics would otherwise allow.
The Manukai was built in 2003. Rather than order a new ship, Matson spent $72 million replacing its main engine at COSCO Shipping Shipyard (Nantong) — a project that ran from summer 2023 through summer 2024.
The reason is structural: a new Jones Act containership of comparable size — such as Pasha Hawaii’s LNG-powered Ohana-class ships — cost over $225 million as of 2022. A comparable conventionally-fueled ship from a South Korean or Japanese yard costs approximately $52 million, less than the cost of the reengining alone at a Chinese state-owned yard.
The Jones Act's build requirement makes new American ships so expensive that operators rationally pour tens of millions into aging hulls at Chinese state-owned yards. The law designed to sustain American shipbuilding is instead sustaining COSCO Nantong's retrofit business.
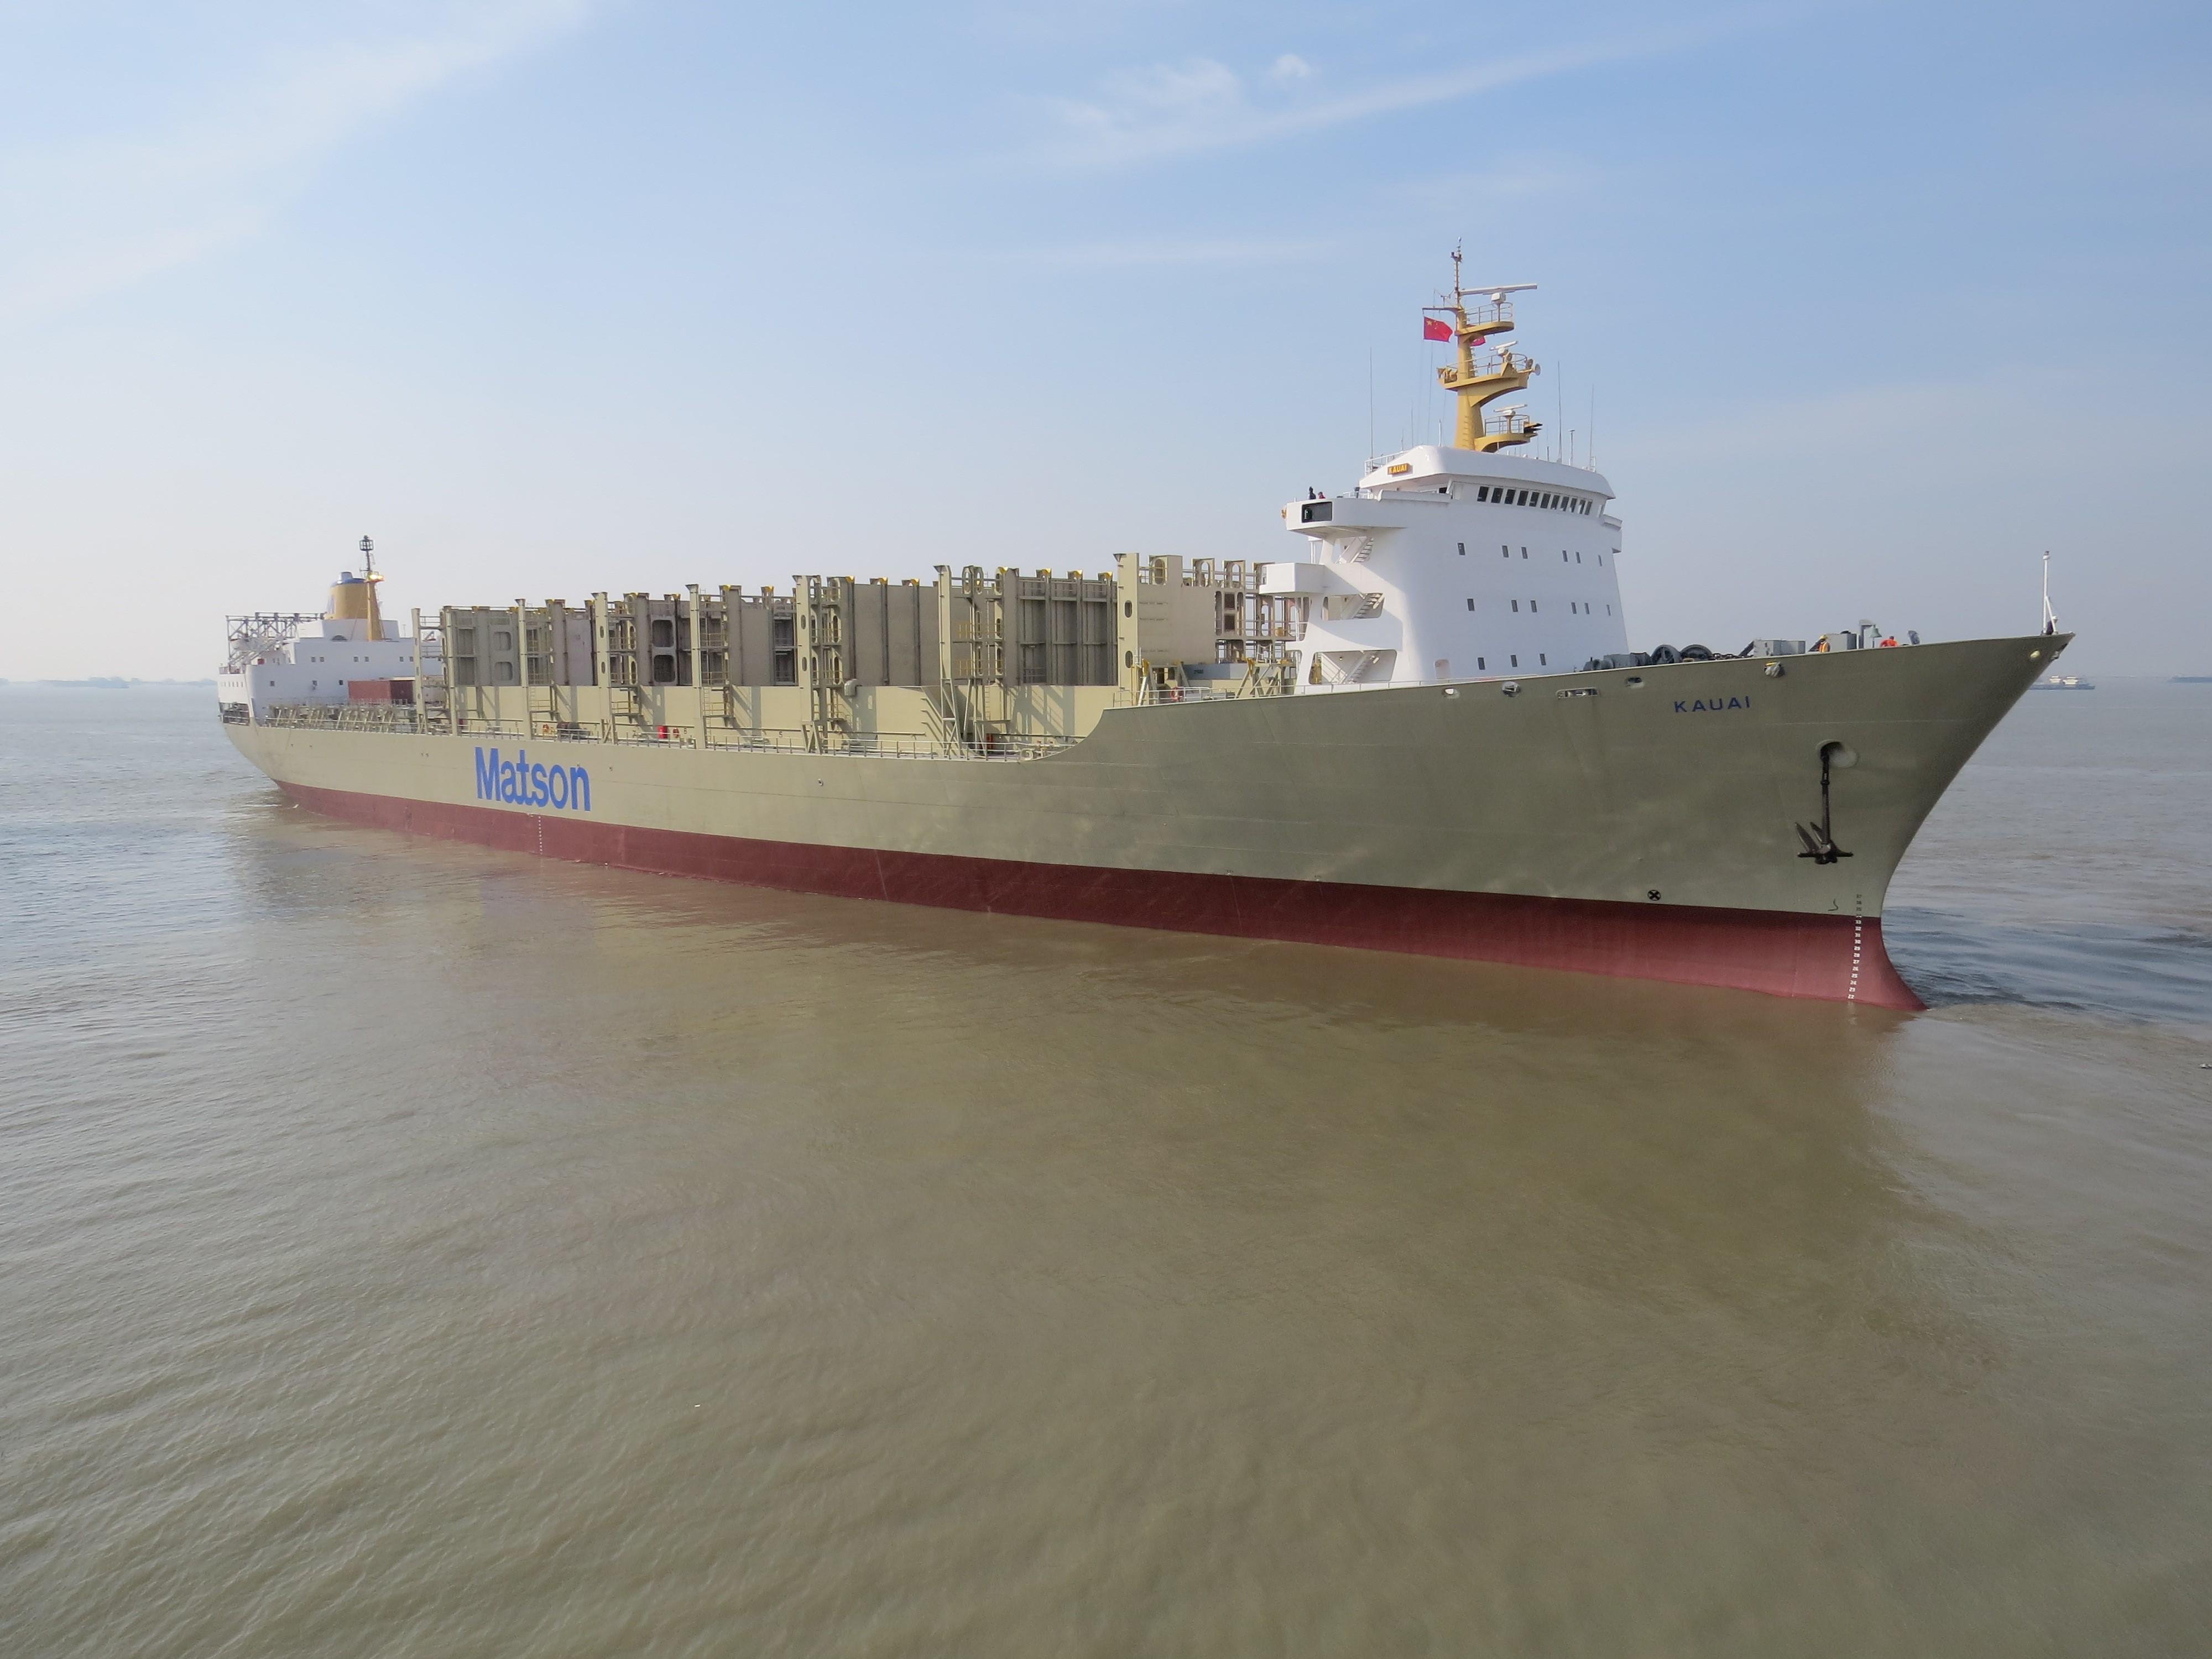
Departing COSCO Shipping Shipyard, Nantong, Jiangsu, China — May 21, 2015. The Kauai, a Jones Act containership built in 1980, operated on the Hawaii trade until it was scrapped in 2020 at around 40 years of age, illustrating the advanced age at which Jones Act vessels are kept in service. A Chinese flag flies from the mast. The image was shared by the Masters, Mates & Pilots Union (@MMP_Union) with the caption: "Gorgeous shot of the Matson KAUAI departing COSCO Nantong Shipyard."
Photo: Scott Hauck, via MM&P Union / X (formerly Twitter), May 21, 2015
Jones Act Vessels — Selected Major Conversions at Chinese Shipyards
Selected USCG-approved foreign rebuild determinations and completed reengining projects, 2001–2025
⬤ CONVERSION ONGOING · USCG ref. 16713/5/3 · July 9, 2025 · to be renamed Russel G
🇺🇸 → 🇨🇳
George II
built 1980 · Pasha Hawaii
COSCO Shipping Shipyard (Nantong)
World's first steam-to-LNG conversion — complete propulsion replacement; ~$100 million. Departed Taicang Port, Jiangsu, December 31, 2023
Completed May 2024
🇺🇸 → 🇨🇳
Horizon Reliance
O/N 625873 · Pasha Hawaii
COSCO Nantong China Shipyard
Complete propulsion replacement: steam → dual-fuel diesel; new LNG tanks; engine room structural modifications; new superstructure
USCG ref. 16713/5/2 · September 29, 2021
🇺🇸 → 🇨🇳
Manukai
built 2003 · Matson Navigation
COSCO Shipping Shipyard (Nantong)
Full LNG reengining — main engine replacement + Type C LNG fuel tanks, C-LNG fuel supply system; $72 million
Completed 2023–2024
🇺🇸 → 🇨🇳
Daniel K. Inouye
built 2018 · Matson Navigation
China (COSCO Nantong, per program pattern)
LNG dual-fuel retrofit: tanks, piping, cryogenic equipment — ~$47 million; $94 million combined final cost with Kaimana Hila
Completed Q3 2023 (first of program)
🇺🇸 → 🇨🇳
Kaimana Hila
built 2019 · Matson Navigation
COSCO Shipping Shipyard (Nantong)
LNG dual-fuel retrofit: tanks, piping, cryogenic equipment — ~$47 million
Contract signed February 2, 2024
🇺🇸 → 🇨🇳
National Glory
Container Carrier · National Shipping of America
Chengxi Shipyard Co., Ltd. (Jiangyin, Jiangsu)
Conversion to container carrier
Completed 2007
🇺🇸 → 🇨🇳
Seabulk Challenge (later Challenge)
52,000 dwt · built 1981 · Seabulk Tankers (Seacor)
COSCO Shipping Shipyard (Nantong)
Double-hull conversion — cost ~$5 million (est.); approximately one-third the best quote received from a U.S. yard. Seabulk executives stated U.S. pricing was cost-prohibitive.
ABS Builder Designation WCN 294819 · May 1, 2006
🇺🇸 → 🇨🇳
Seabulk Trader (scrapped 2018)
52,000 dwt · built 1981 · Seabulk Tankers (Seacor)
COSCO Shipping Shipyard (Nantong)
Double-hull conversion — same program as Seabulk Challenge; sister vessel. Combined conversion cost estimated at ~$10 million vs. roughly $30 million at a U.S. yard.
Completed c. 2006 · scrapped 2018
🇺🇸 → 🇨🇳
Mokihana
built 1983 · Matson Navigation · scrapped 2026
COSCO Nantong (COSCO Shipping)
Conversion from pure containership to ConRo (car/heavy cargo decks); ro-ro garage added at Alabama shipyard
Completed c. 2007 · USCG eligibility upheld in federal court
Sources: Horizon Spirit — USCG NVDC ref. 16713/5/3, July 9, 2025, dco.uscg.mil; towed San Diego→Nantong by Maverick I, September 2025 (KipperT, shipspotting.com). Horizon Reliance — USCG NVDC ref. 16713/5/2, September 29, 2021, dco.uscg.mil. George II — Pasha Hawaii YouTube, May 20, 2024; Taicang Port departure @shipspotter_delvestudio (Instagram), December 31, 2023. Manukai — Matson 10-K; C-LNG Solutions / COSCO Shipping LinkedIn post. Daniel K. Inouye — Matson 10-K; Alphaliner via TradeWinds, April 13, 2022. Kaimana Hila — Offshore Energy, February 5, 2024; Matson 10-K. Mokihana — Bob Rust, "Jones Act row hots up," TradeWinds, April 12, 2007. National Glory — Chengxi Shipyard Co. designated as Primary Repair Yard: ABS Record (absrecord.eagle.org), Builder Designation tab, "Conversion to Container Carrier," September 1, 2007, WCN 505729, Jiangyin, Jiangsu, China. Seabulk Challenge / Seabulk Trader — double-hull conversion at COSCO Nantong: ABS Record (absrecord.eagle.org), Builder Designation tab, WCN 294819, "Double Hull Conversion," Primary Repair Yard: COSCO Shipping Shipyard (Nantong) Co., Ltd., May 1, 2006; cost (~$5M/vessel, one-third of best U.S. quote) and executive statements: "Shocked by US Costs," TradeWinds, tradewindsnews.com/weekly/shocked-by-us-costs/1-1-218269. Seabulk Trader scrapped 2018: MARAD Merchant Fleet statistics.
Note on sourcing: COSCO Nantong partnership with Matson (50th ship ceremony, 2019): China Daily, "COSCO celebrates 20-year partnership with Matson," July 12, 2019, archived at web.archive.org. Mokihana conversion at COSCO Nantong and federal court ruling: Bob Rust, "Jones Act row hots up," TradeWinds, April 12, 2007 (tradewindsnews.com). Maunalei at COSCO Nantong floating dock Yuantong 8: -EZEK, Flickr (flickr.com/photos/98415324@N07/49608641961), photograph taken April 22, 2016, uploaded March 2, 2020. Record 60th repair (2021): China COSCO Shipping Corporation press release, reported by ship.gr, October 8, 2021. Horizon Reliance COSCO Nantong conversion: USCG NVDC determination letter, ref. 16713/5/2, September 29, 2021, dco.uscg.mil. Horizon Spirit conversion at COSCO Nantong: USCG NVDC determination letter, ref. 16713/5/3, July 9, 2025, dco.uscg.mil; vessel towed San Diego→Nantong by Maverick I, September 17, 2025, photographed by KipperT, shipspotting.com (added Oct. 25, 2025), description states "extensive modifications including main engine replacement." Horizon Spirit departure from San Diego: @SanDiegoWebCam, July 27, 2025. George II Taicang Port departure: @shipspotter_delvestudio (Instagram), December 31, 2023 (IMO 7729461); conversion date, description, and cost: Pasha Hawaii YouTube, May 20, 2024; ~$100M per Heritage Foundation. Matson three-vessel LNG retrofit program at COSCO Nantong: Matson 10-K; Manukai yard confirmed by C-LNG Solutions LinkedIn post; $72M cost per Matson Annual Report (10-K); $74M per The Maritime Executive, December 13, 2024; Manukai at Nantong summer 2023–summer 2024 per Maritime Hawaii (maritimehawaii.com, January 15, 2025). Japanese/Korean Feedermax (2,700 TEU) newbuild price of $52M: BRS Shipbuilding Report, End 2025. Daniel K. Inouye China location confirmed by Alphaliner via TradeWinds, April 13, 2022; $94M combined final cost for Daniel K. Inouye and Kaimana Hila per The Maritime Executive, December 13, 2024. Kaimana Hila contract at COSCO Nantong: Offshore Energy, February 5, 2024. National Glory at Chengxi Shipyard Jiangyin: general cargo to containership conversion confirmed by National Shipping of America, Q2 2023 Letter from the President; ABS Record (absrecord.eagle.org), Builder Designation, WCN 505729, "Conversion to Container Carrier," Primary Repair Yard: Chengxi Shipyard Co., Ltd., No. 1 Hengshan Road, Jiangyin, Jiangsu, September 1, 2007. MARAD study on foreign repair costs: U.S. Department of Transportation, Maritime Administration, Comparison of U.S. and Foreign-Flag Operating Costs, September 2011. Horizon Lines COSCO Zhoushan: PandaNews, 2013, cited by Grassroot Institute. Resolve Pioneer Zhoushan determination: USCG NVDC, ref. 16713/8/2, July 28, 2017, dco.uscg.mil. Master Boat Builders customs import records remain a pending additional evidentiary thread.
Section 06
The Long View
The United States was once a highly competitive shipbuilding nation, but that has not been the case since ships were made of wood. The competitive advantage that made early maritime protection a nearly cost-free proposition disappeared before the Civil War and has not returned. The two world wars were anomalies in a period of decline that now stretches back more than 150 years.
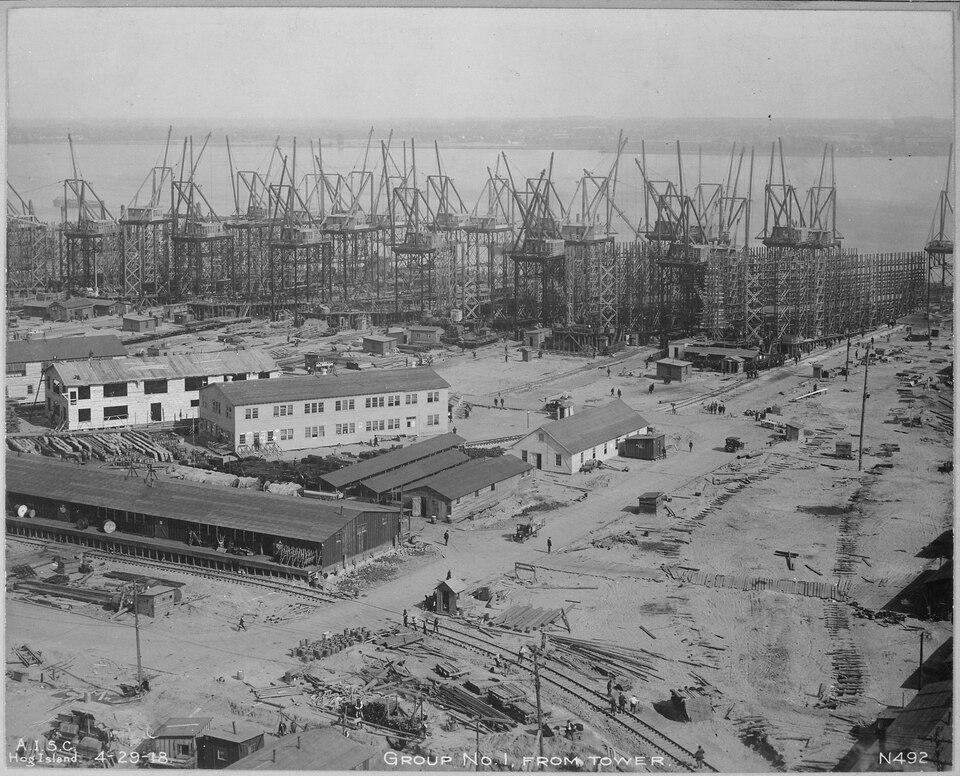
The decline of American commercial shipbuilding is not a recent phenomenon. The industry has not been internationally competitive since the era of wooden ships, and its extraordinary performance during World War II only temporarily obscured a long-standing competitive deficit. The postwar decline is properly viewed not as the fall of a shipbuilding giant, but as a logical regression to an uncompetitive baseline. The country's shipbuilding problems are not new but long-standing and well-documented.
That this has taken place under the Jones Act's watch is neither surprising nor coincidental. The law is not rooted in timeless principles, but in the conditions of a particular moment, when American shipbuilders were genuinely competitive and the difference between a merchant vessel and a warship was far less pronounced. In other words, a world far removed from today's. It is both notable and instructive that no other shipbuilding country of significance relies on such severe protectionism to advance the fortunes of its industry.
When protection cost nothing
American shipbuilding in the country's early days was a highly competitive industry, so much so that when the Revolution began, an estimated one-third of all seagoing merchant ships flying the British flag were of American construction. Vast forests and ample supplies of timber, along with skilled shipwrights, meant that, as Winthrop Marvin noted, a live oak vessel could be built in New England for $38 a ton compared to at least $50 per ton in Britain. Protectionist measures to encourage the use of U.S.-built ships therefore imposed little if any cost.
"The best wooden ships in the world were available from domestic shipbuilders at lower prices than foreign shipbuilders could meet. With the advent of the metal ship, shortly before the Civil War, the U.S. owner lost this construction cost advantage."
According to maritime historian Winthrop L. Marvin, the requirement that American ships be built in American yards was "by no means an actual handicap," with such vessels so competitively built that "there was generally no advantage" in purchasing them abroad. The Abandoned Ocean by Andrew Gibson and Arthur Donovan concurs, declaring that early forms of protection "cost the nation nothing, since the American producers of these goods (ships) and services (shipping) were highly competitive."
Construction of the Frigate Philadelphia at Southwark, Philadelphia, 1800. In the colonial era, American yards were among the most competitive in the world. William Birch, "Preparation for War to defend Commerce," line engraving, 1800. Rare Book and Special Collections Division, Library of Congress. Public domain.
This advantage, however, would dissipate as iron replaced wood and steam replaced sail. According to F.G. Fassett Jr.'s authoritative 1948 history, The Shipbuilding Business in the United States of America, Great Britain was already building 50 percent of its vessels in iron or steel as early as 1864. In contrast, the United States did not reach that threshold until 1900. U.S. shipyards lost their cost advantage shortly before the Civil War, and by 1869 U.S.-built wooden ships cost about as much as British iron ships. Rather than innovate, Gibson and Donovan observed that American yards "stuck to what they did best, building and operating wooden sailing ships." This is exactly the type of behavior one should expect in a market insulated from foreign competition.
As the steam-and-steel transition became entrenched, U.S.-flag shipping operators sought permission to purchase foreign-built steamships. The shipbuilding industry, still dominated by wooden vessel construction, strongly opposed the measure, and it failed to gain sufficient political support. In the Naval War College Review, Christopher McMahon notes that “as a result, many U.S.-flag shipping companies went out of business.”
Once lost in the 1860s, American cost competitiveness in shipbuilding was never regained. The American cost premium has been consistently documented by government bodies and industry observers ever since:
"It is practically impossible now to build vessels in this country for the foreign carrying trade, because they can be more cheaply built elsewhere."
New York Times, May 16, 1892 — thirty years before the Jones Act
The U.S. Shipbuilding Cost Premium, Colonial Times–Present
Documented cost differential between U.S. and foreign commercial shipbuilding · all figures from primary government or industry sources
Year
Premium
Source
Pre-1775
U.S. cheaper — $24–38/ton vs. $50+ in Britain (~25–50% U.S. advantage)
Winthrop L. Marvin, The American Merchant Marine (1902)
1800–1840
U.S. cheaper — £3–4/ton vs. £5–7/ton in England (~30–45% U.S. advantage)
$100/ton U.S. vs. $40/ton Canada — U.S. ~150% more expensive (Frank Leslie's Illustrated Newspaper)
Frank Leslie's Illustrated Newspaper (1867); Rodney Carlisle, Rough Waters: Sovereignty and the American Merchant Flag (2004), p. 48
1869
Iron ships 33% more expensive in U.S. than Britain
Fassett, ed., The Shipbuilding Business in the U.S.A. (SNAME, 1948)
1899
~$67/gross ton U.S. vs. 30–40% less at British yards, for steel square-riggers built for Hawaii trade
F.G. Fassett Jr., ed., The Shipbuilding Business in the United States of America (SNAME, 1948), p. 47
1900
28% in favor of English builder (Commissioner of Navigation)
Royal Meeker, History of Shipping Subsidies (AEA, 1905)
1905
P.A.S. Franklin (IMM): ~40%; American bids vs. British/German yards for North Atlantic steamships, communicated to the Commission: 47% and 37%; F.W. Wood (Maryland Steel Co.) testimony: 30–50% average
S. Rpt. 2949, 58th Congress, 3d Session (Jan. 12, 1905), Development of the American Merchant Marine and American Commerce, p. 8
Pre-WWI
25–40%; projected ≥20% post-war
U.S. Shipping Board, Government Aid to Merchant Shipping (1922), p. 60
1929
33–65% depending on vessel type (cargo ships up to 13 knots: 60–65%; combination passenger: ~50%; passenger 15–20 knots: 40–45%; large express steamers: ~33⅓%)
50% on actual contract ($15.75M vs. $10.5M for comparable vessel)
U.S. Maritime Commission, Economic Survey of the American Merchant Marine, House Doc. 392 (1937)
1950s–1961
~100% ("double those of foreign yards"; "almost twice as much as foreign costs")
Congressional Research Service, Report R45725 (Frittelli); Sen. Hiram Fong, testimony in Domestic Offshore Shipping, Hearings before the Merchant Marine and Fisheries Subcommittee, Committee on Interstate and Foreign Commerce, U.S. Senate, 87th Congress, 1st Session, March 6, 7, 13, and 14, 1961 (Washington: GPO, 1962)
1990s
~200% (three times the price of foreign yards)
Congressional Research Service, Report R45725 (Frittelli)
2026
~347–362%+ (containership: $335M vs. ~$75M; MR tanker: >$240M vs. $52M)
Containership — Matson, Inc., Annual Report 2025 ($335M); James Lightbourn, founder of Cavalier Shipping, a shipping financing advisory, quoted in New York Times (Feb. 2026) (~$75M international equivalent). MR tanker — Kinder Morgan, 2026 Annual Business Update (Jan. 2026) (>$240M, stated as a floor); Compass Maritime Weekly Report (Aug. 3, 2026) ($52M). The 362% tanker figure is itself a floor, since Kinder Morgan's cost is stated as ">$240MM."
Sources listed in table. Cost comparisons are not strictly equivalent across eras — ship types, measurement conventions, and market conditions differ. The direction of the differential is consistent and uncontested in every period.
Documented observations, colonial times–2026 · hover for source
Point estimateRange
Cost comparisons are not strictly equivalent across eras — ship types, measurement conventions, and market conditions differ. Each point represents an independently documented observation. Hover for source. The direction of the differential is consistent and uncontested in every period.
The World War anomalies
Both world wars saw enormous surges in U.S. shipbuilding output. These spikes, and particularly that of World War II, have fed a narrative that the U.S. is now a shipbuilding giant brought low, and that its wartime performance reflected its underlying commercial prowess. But this misreads history. While the production increases were genuine achievements of industrial mobilization, they were not evidence of peacetime commercial competitiveness. Nor were they the fruit of the shipbuilding protections offered by U.S. coastwise laws.
The U.S. experience in World War I laid bare the inadequacy of domestic shipbuilding capacity. When the United States found itself at war and scrambling for ships to transport U.S. forces to France, its shipyard base could not implement a building program of the required magnitude.
New yards had to be built from scratch. The Hog Island shipyard across the Delaware River from Philadelphia rose from a mud flat in a matter of months to become the world’s largest shipyard, capable of simultaneously building fifty ships. To augment private yards, the Emergency Fleet Corporation opened four of its own: at Bristol, Rhode Island; Newark, New Jersey; Wilmington, North Carolina; and Hog Island itself — which collectively accounted for 25 percent of U.S. shipbuilding.
The desperation to secure ships manifested in other ways, too. The U.S. government, via the Emergency Fleet Corporation (EFC), awarded contracts to shipyards in China (the Kiangnan Dock & Engineering Works in Shanghai) and Japan for 45 ships totaling 375,000 tons. Furthermore, nearly a third of the EFC's 3,282-ship program — 1,017 vessels — was built from wood.
This is perhaps less surprising than it seems. Of 61 shipyards at the time the United States entered the war, 24 were devoted to wooden construction. The results were poor. Of an original program of 1,017 wooden vessels, shipyards had delivered just 87 by the Armistice — none of which had crossed the Atlantic (though 167 wood and composite vessels would make the voyage in 1919).
Hog Island Shipyard, Philadelphia, April 29, 1919 — 50 building ways stretching along the Delaware River, the largest shipyard in the world, built from scratch on a mud flat in months to meet WWI demand. Its first ship was not delivered until after the Armistice. U.S. Shipping Board / NARA 533741. Public domain.
The shipbuilding problems were not limited to wooden vessels. According to the U.S. Shipping Board's own annual reports, although hundreds of steel ships would be built, the vast majority were delivered after hostilities had ceased. Of 1,693 steel ships delivered by the time the wartime shipbuilding program terminated, only 399 (roughly 24 percent) had been completed before November 1, 1918. Of those 399, fewer than one-third — 127 — were built from scratch, with the remainder consisting of ships already at various stages of completion that were requisitioned for the war effort. Not a single ship constructed at Hog Island was delivered in time to serve during the war.
"The other lesson is the unwisdom of America and our risk of defeat because we had practically no ships on the high seas when we entered the war."
General John J. Pershing, Commander in Chief, American Expeditionary Forces — speaking at the Sixth National Conference on the Merchant Marine, January 1933, entered into the congressional record of the 1935 hearings on H.R. 7521
The vast sums spent on new vessels — approximately $3.3 billion, or $60–65 billion in 2024 dollars — did not set the stage for a new era of competitive American shipbuilding. Indeed, the end of the wartime effort saw commercial output collapse and remain nearly dormant for most of the 1930s. In 1935 hearings before the House Committee on Merchant Marine and Fisheries, the Solicitor for the Department of Commerce, South Trimble Jr., testified that in the previous five years, U.S. shipyards had built just 4 freighters of 2,000 gross tons and over, and just another four in the five years before that. The equivalent figures for Great Britain were 295 and 558.
Further testimony drove the point home. H.G. Smith, president of the National Council of American Shipbuilders, told the committee that "in the United States there has been practically no cargo-vessel construction during the 10-year period, while all other important maritime nations have extensively built vessels of this type." During the same period, Britain renewed 41 percent of its cargo fleet. The figures, Smith concluded, were simply "deplorable." A report from the U.S. Chamber of Commerce's special committee on the merchant marine, included as an appendix to the hearing transcript, added that the industry had been "several times, during the past 10 years, on the verge of virtual disintegration due to lack of work."
By the time the Maritime Commission issued its 1938 annual report to Congress, matters had not improved. The U.S. shipbuilding industry was so depleted that the report noted that no ocean-going merchant vessels had been built on the Gulf or Pacific coasts since World War I.
Fassett's The Shipbuilding Business records the industry reaching its nadir in the mid-1930s with just four ships over 2,000 gross tons — two cargo ships and two tankers — delivered across 1934 and 1935 (p. 78).
The Maritime Commission's own 1939 Economic Survey of Coastwise and Intercoastal Shipping offered a matching verdict: with few exceptions, there had been "practically no vessels constructed for the coastwise and intercoastal trades subsequent to the completion of the Government's war-built fleet."
There were, of course, extenuating circumstances. The Great Depression no doubt contributed to the decline, as did the enormous amount of war-built tonnage sold off into the market at cut-rate prices. Between January 1, 1922 and August 30, 1934, 71 vessels built at a cost of approximately $200 per ton were sold at an average of just $20.98 per ton, a ten-to-one write-down. But these are far from the whole story. The failure of U.S. coastwise restrictions to foster robust levels of commercial ship construction was already a long-established theme.
Writing in The Atlantic in 1909 — twenty years before the Great Depression began — Winthrop Marvin observed that the great American shipyards "cannot be successfully maintained either by the demands of the present naval programme or by the relatively light and fitful work of the coastwise trade." [emphasis added] Fassett, meanwhile, noted that prior to 1914, 75 percent of U.S. shipbuilding capacity was found in naval work, not commercial construction. It was a dependency that industry insiders were still acknowledging a decade later.
In 1924 testimony before Congress, Captain Charles McAllister, Vice President of the American Bureau of Shipping, stated plainly that naval construction had "kept the yards fairly well employed" and that "the Navy has furnished the backbone of the shipyards." Merchant marine construction, he added, was "incidental, more or less."
This pattern persists: a 2021 MARAD report found that military shipbuilding and repairs accounted for 78.7 percent of U.S. shipbuilding and repair industry revenue in 2019. The heavy reliance on military contracts was further confirmed in 2024 by Sam Norton, CEO of Jones Act tanker company Overseas Shipholding Group, who noted that "the occasional vessel built to operate within the Jones Act is, for most [U.S. shipyards], a minor sideline interest."
Despite the dearth of commercial construction for most of the interwar period, two developments meant the U.S. shipbuilding industry was not starting entirely from scratch on the eve of World War II. The Merchant Marine Act of 1936 had established the Construction Differential Subsidy and created the Maritime Commission, which began placing orders for new merchant vessels and slowly reactivating yards that had fallen idle.
And in December 1940 — a full year before Pearl Harbor — Britain contracted with Todd Shipyards for 60 Ocean-class cargo ships worth $100 million, to be built in entirely new yards constructed for the purpose. The design, adapted from a British tramp steamer, became the direct template for the Liberty ship, and the yards built for the Ocean-class order went immediately into Liberty hull production once the U.S. entered the war.
The resulting effort was undeniably impressive, with American yards delivering roughly 5,000 cargo ships during the war, a feat of industrial mobilization without precedent. But that achievement did not obscure the fact that the United States had entered the war on the shipbuilding backfoot.
The Harvard University Graduate School of Business Administration, in a report prepared for the U.S. Navy Department and the U.S. Maritime Commission, was unequivocal: “…when the United States entered both World Wars the national security of the United States was seriously threatened because the country had failed to have a shipbuilding and a shipping industry suitable to its security requirements.” The American Merchant Marine Institute, meanwhile, acknowledged that “this country found itself at the outset of the conflict with a woefully inadequate fleet of American-flag ships and a lack of sufficient shipyard capability to build the necessary vessels.”
Two conclusions follow from the American shipbuilding experience in the world wars. First, requiring that vessels engaged in coastwise commerce be domestically built could not generate the volume or competitive pressure needed to sustain an industry capable of building ocean vessels. Second, those tempted to blame the Great Depression for shipbuilding’s interwar torpor must engage in some reflection. If the Jones Act’s build requirement can only be relied upon to produce shipbuilding when economic conditions are favorable, then it is not a durable national security asset but a fair-weather arrangement.
The Jones Act was not the only tool the United States employed to encourage its shipbuilding industry. The postwar period offered one more test, in the form of direct subsidies.
SS John W. Brown, a Liberty ship built in Baltimore in 1942 — one of 2,710 built during WWII using assembly-line methods borrowed from the automobile industry, because there were not enough experienced shipbuilders to do it the traditional way. One of only two surviving operational Liberty ships. Photo: Wikimedia Commons.
The Construction Differential Subsidy, formalized under the Merchant Marine Act of 1936 and expanded significantly by the Merchant Marine Act of 1970, was the most sustained and generous peacetime attempt to close the cost gap through direct federal intervention. At its peak the program paid the difference between American and foreign construction costs — up to a statutory ceiling of 50 percent of the vessel's price — for ships operating in international trade. Between 1936 and 1981 it disbursed $3.8 billion to American shipyards.
Although the program did prompt additional shipbuilding, simply covering the difference between U.S. and foreign prices proved an ineffective means of making U.S. shipbuilding competitive. By the late 1970s, with the program still running at full force, the cost gap had outgrown the subsidy’s legal reach. Foreign yards, particularly those in Japan, were quoting prices 60 percent below American levels. Avondale, widely considered the most efficient commercial yard in the country (since closed), required a 49.98 percent subsidy — essentially the legal ceiling — just to win a single contract in 1979. Overseas, two comparable ships could be built for the price of one American vessel.
The subsidies were discontinued in 1981, but the commercial order book had already begun to crumble before that. In a letter transmitting MARAD's 1979 annual report, the Secretary of Commerce warned that the near-term outlook for commercial shipbuilding was "clouded" and that "we cannot afford to overlook either the magnitude or significance of the problems" facing the broader maritime industry. In the following year's annual report, MARAD disclosed that no CDS contracts had been awarded for new ship construction.
Contemporary press coverage documented the deterioration in real time. By 1978, Business Weekwas warning of imminent shipyard closures despite the subsidy program still running at full force. A Baltimore Suninvestigation the following year found the industry in its most serious postwar crisis, with major yards expected to close one by one. By mid-1980, the New York Timesreported only three commercial ship orders that year, and industry leaders were calling for government intervention to stave off collapse. The subsidies had not arrested the sector's decline but had merely slowed it.
The 1981 defunding of the CDS program accelerated the collapse of commercial shipbuilding, but the trajectory was already clear. A subsidy program hitting its legal ceiling while the cost gap continued to widen was not sustainable in the long term, and notions that U.S. commercial shipbuilding would be in a dramatically different place today with CDS in place should be greeted with skepticism.
What the record shows
Looking back across the sweep of U.S. commercial shipbuilding history, the Jones Act's record in promoting its fortunes is difficult to defend. The United States is the world's second-largest manufacturing economy and is renowned for its dynamism and innovation, yet it ranks just nineteenth in shipbuilding. It trails not just Asian giants but European countries whose industries operate without a protected domestic market. With commercial output already near zero, it strains credulity to argue a different policy path could have produced worse results.
The causes of decline are multifactorial, and it is very possible — even likely — that the United States would not have become a major shipbuilding nation under any policy regime. But the current record would not be difficult to improve upon. One can imagine American yards, freed from the artificial shelter of the Jones Act and the comfort of captive military contracts, having developed specialized niches and competing selectively in world markets. But that path was never taken.
The Jones Act's origins lie in an era when merchant vessels could be converted into privateers to hunt enemy shipping, and American commercial shipbuilding was competitive enough that protectionist shipping measures imposed relatively little cost. That world is long gone, and a law rooted in it is ill-suited for the twenty-first century.
Sources for this section: British 50% iron/steel threshold of 1864, thirty-six-year lag, and 1869 cost-parity figures: F.G. Fassett Jr., ed., The Shipbuilding Business in the United States of America, Vol. I (New York: Society of Naval Architects and Marine Engineers, 1948), p. 75; National Research Council, Role of the U.S. Merchant Marine in National Security; Project Walrus Report (1959), p. 1. U.S. iron/steel shipbuilding surpassing wooden construction only in the 1890s decade: Alexander R. Smith, "Shipbuilding," in U.S. Census Bureau, Twelfth Census of the United States, Census Bulletin No. 166 (Washington: GPO, May 5, 1902), p. 3. National Academies of Sciences, report on U.S. merchant marine policy. Winthrop L. Marvin, The American Merchant Marine: Its History and Romance from 1620 to 1902 (1902). Winthrop L. Marvin, "American Ships and the Way to Get Them,"The Atlantic, October 1909. Winthrop L. Marvin, "How Can American Ships Compete Successfully with Foreign Ships?", paper read at the twenty-ninth general meeting of the Society of Naval Architects and Marine Engineers, New York, November 17–18, 1921 (drive.google.com). Andrew Gibson and Arthur Donovan, The Abandoned Ocean: A History of United States Maritime Policy (University of South Carolina Press, 2000) — "cost the nation nothing" quote: p. 49; "stuck to what they did best" quote: p. 49. Rodney Carlisle, Rough Waters: Sovereignty and the American Merchant Flag (2004). F.G. Fassett Jr., ed., The Shipbuilding Business in the United States of America, Vol. I (SNAME, 1948). Royal Meeker, History of Shipping Subsidies (American Economic Association, 1905). S. Rpt. 2949, 58th Congress, 3d Session, Development of the American Merchant Marine and American Commerce (Merchant Marine Commission report, Jan. 12, 1905), p. 8 — testimony of P.A.S. Franklin, International Mercantile Marine; American-vs.-British/German bid data communicated to the Commission; and testimony of F.W. Wood, Maryland Steel Company. New York Times, May 16, 1892. Pacific Commercial Advertiser, October 14, 1908 (quoting Nautical Gazette). A.C. Denison, Lt. USNR, America's Maritime History (G.P. Putnam's Sons), p. 134. Ronald A. Shadburne, "Coastwise and Intercoastal Shipping," Annals of the American Academy of Political and Social Science, Vol. 230 (November 1943), pp. 29–36. U.S. Shipping Board, Government Aid to Merchant Shipping (1922), p. 60. Admiral H.I. Cone, Commissioner, U.S. Shipping Board, cost differential figures by vessel type: Proceedings of the Second National Conference on the Merchant Marine, January 23–24, 1929. Committee on Differential in Cost of Shipbuilding, 50–60% general differential and up to 100% in some instances: Proceedings of the Third National Conference on the Merchant Marine, April 23–24, 1930. American Merchant Marine Institute, A New National Maritime Policy. House Committee on Merchant Marine and Fisheries, To Develop an American Merchant Marine, Hearings on H.R. 7521, 74th Congress, 1st Session (1935) — H.G. Smith testimony (National Council of American Shipbuilders); U.S. Chamber of Commerce special committee on the merchant marine report, appended at p. 1197. U.S. Maritime Commission, Report to Congress for the Period Ended October 25, 1938 (Washington: GPO, 1939). U.S. Maritime Commission, Economic Survey of Coastwise and Intercoastal Shipping, House Document, 76th Congress, 1st Session (March 16, 1939). U.S. Maritime Commission, Economic Survey of the American Merchant Marine, House Document 392, 75th Congress (1937). MARAD, Economic Contributions of the U.S. Shipbuilding and Repairing Industry (June 2021) — military share of industry revenue (78.7%, 2019 data). MARAD, Merchant Marine for Trade and Defense (1946). Vice Adm. A.J. Herberger USN (Ret.), Kenneth C. Gaulden, and Cdr. Rolf Marshall USN (Ret.), Global Reach: Revolutionizing Commercial Intermodal Transport (Naval Institute Press, 2012). Clinton H. Whitehurst Jr., The U.S. Merchant Marine: In Search of an Enduring Maritime Policy (Naval Institute Press, 1983) — 1800–1840 cost comparison (£3–4/ton U.S. vs. £5–7/ton England): p. 1. Clinton H. Whitehurst Jr., The U.S. Shipbuilding Industry: Past, Present, and Future (Naval Institute Press, 1986). Harvard University Graduate School of Business Administration, The Use and Disposition of Ships and Shipyards at the End of World War II, prepared for the U.S. Navy Department and the U.S. Maritime Commission (June 1945) — section heading: "Failure to Have Adequate Ships and Shipyards." Frederic C. Lane, Ships for Victory: A History of Shipbuilding under the U.S. Maritime Commission in World War II (Johns Hopkins University Press, 1951). Christopher J. McMahon, "The U.S. Merchant Marine: Back to the Future?,"Naval War College Review, Vol. 69, No. 1 (Winter 2016). Salvatore R. Mercogliano, "The Shipping Act of 1916 and Emergency Fleet Corporation,"The Northern Mariner, Vol. 26. China and Japan foreign construction: N.L. McKellar, "Steel Shipbuilding Under the U.S. Shipping Board, 1917–1921," The Belgian Shiplover, No. 87 (Mai/Juin 1962), pp. 270–277; Mercogliano, op. cit. (45 ships/375,000 tons figure). Steel ship delivery statistics (399 delivered before Nov. 1, 1918; 127 contract steel; 1,693 total completed): Second Annual Report of the United States Shipping Board (Washington: GPO, 1918), Table VII(b), p. 179 (for wartime deliveries); Sixth Annual Report of the United States Shipping Board (Washington: GPO, 1922), Table XII (for final program totals). Wooden ships ordered, delivered, mechanical failures: National Trust for Historic Preservation, "Ghost Fleet of the Potomac, Mallows Bay" (citing U.S. Shipping Board records). Wooden ship share of EFC program (1,017 of 3,282): Mercogliano, op. cit., citing Hurley, The Bridge to France, Chapter VII. Naval work as "backbone" of shipyards, merchant construction "incidental": Statement of Capt. Charles A. McAllister, Vice President, American Bureau of Shipping, in Admission of Foreign-Built Ships to American Registry, Hearings on H.R. 3216, House Committee on Merchant Marine and Fisheries, 68th Congress, 1st Session (February 28 and March 4, 1924). Pre-1914 naval capacity share (75%): F.G. Fassett Jr., ed., The Shipbuilding Business in the United States of America, Vol. I (SNAME, 1948), p. 52.
Section 07
Methodology & Limits
What this project claims, how the data was assembled, and where the evidence is stronger or weaker.
What this project is. This site assembles primary-source data on U.S. commercial shipbuilding output, fleet size, vessel costs, and the cost premium of U.S.-built ships relative to foreign equivalents, and traces the history of American shipbuilding from the colonial era through the collapse of the Construction Differential Subsidy program in 1981. It draws analytical conclusions from that data and history, including about the Jones Act’s role in shaping — and failing to sustain — the U.S. shipbuilding industry. Every figure is sourced to a specific document; where estimates are used, the basis for the estimate is stated.
What this project is not. It is not a comprehensive economic model of the Jones Act’s costs and benefits. It does not attempt to quantify the full downstream effects of the shipbuilding cost premium on freight rates, consumer prices, or specific markets. It does not attempt a full accounting of national security tradeoffs, which involve considerations beyond the scope of shipbuilding cost and output data. It is a data-driven historical analysis, not a policy brief.
Conservative estimation throughout. Where a range of figures is available, this project uses the more conservative estimate. Where a source provides a lower-bound figure (e.g., Kinder Morgan's ">$240M"), that floor is used rather than a midpoint or upper estimate. This is consistent with the approach taken in the underlying research: claims are supported only to the degree the evidence warrants, and no figure is presented with more precision than the source justifies.
Primary sources over secondary. The default sourcing hierarchy is: (1) government data — MARAD, UNCTAD, CRS, GAO; (2) operator disclosures — annual reports, investor presentations, SEC filings; (3) industry data — BRS Group, classification society records; (4) contemporaneous press and congressional testimony. Secondary aggregators are used only where primary sources are unavailable or where they synthesize data across multiple primary sources.
The cost premium series (Section 03). The historical cost premium table spans 1775 to 2026 using heterogeneous sources: contemporary price data, government surveys, congressional testimony, operator disclosures, and CRS analysis. These are not drawn from a single consistent methodology. The 1950s–1961 entry is based on two independent sources (CRS R45725 and Senate testimony) that reach the same figure; earlier entries reflect different benchmarks (iron ships vs. British equivalents, contract prices, survey data). The table documents that a premium has existed continuously and grown substantially — it does not claim the figures are directly comparable across periods.
Fleet counts. The Jones Act eligible fleet figures use MARAD's vessel inventory reports as the primary source. "Eligible" means vessels that meet the four Jones Act requirements (U.S.-built, U.S.-documented, U.S.-owned, U.S.-crewed) and are in active oceangoing domestic trade. Vessels in layup, reserve, or government service are excluded. MARAD's reporting methodology has changed over time; figures before and after 2014 are not drawn from identical datasets. Fleet DWT comparison: 1951 fleet DWT of 5,333,000 is from the MARAD Annual Report series (see fleet DWT chart data). Current Jones Act fleet DWT of 4,788,996 is calculated from MARAD, United States Flag Privately-Owned Merchant Fleet Report, April 4, 2026, summing deadweight tonnage for all 92 Jones Act eligible vessels. Real GDP growth (more than nine times) is based on BEA GDPCA chained 2017 dollars via FRED, comparing 1951 to 2025.
Global output comparisons. World shipbuilding output figures use UNCTAD's Review of Maritime Transport and MARAD Annual Reports for the 1951–2001 period, and UNCTAD data for 2001–present. These measure gross tonnage or deadweight tonnage delivered; the U.S. share figures are calculated from those series. The series is not continuous across all years — missing data points are noted in the chart.
The China supply chain section (Section 05). Component origin data for individual vessels is drawn from ABS classification records, MARAD vessel construction documentation, USCG NVDC determination letters, and customs import records. These sources do not cover all components in all vessels; the data reflects what is documented, not necessarily a complete supply chain audit. The Caleb Petitt dataset covers 93 vessels tracking four component categories; it does not claim to be exhaustive across all component types.
Rounding and approximation. Figures presented as approximate (prefixed with ~) reflect either rounding of a precise figure or a range in the underlying source. Figures presented without approximation markers reflect the exact figure as stated in the primary source. Per-TEU and per-DWT cost calculations are derived from reported vessel costs and design capacity; actual unit economics will vary with utilization.
Last updated. Data current as of June 2026. Sources with specific publication dates are noted in chart source lines. MARAD fleet data reflects the April 2026 vessel inventory report.